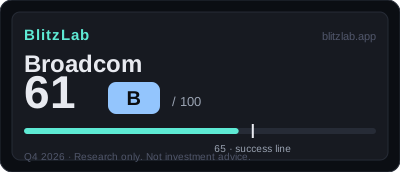
Broadcom — Blitz Index 61 (B)
13 straight quarters of AI semiconductor acceleration — the second blitz is underway.
Last re-scored: October 15, 2026.
Confidence: High · S&P 500 · Nasdaq-100 · Category: ai-infra
Score breakdown
| Section | Score | Detail |
|---|---|---|
| A · Speed | 20 / 25 | Q3 FY2026 +86% YoY; AI semiconductors +221% YoY, 13th straight quarter |
| B · Moat | 36 / 60 | Custom XPU 6 customers + ~$110B order backlog; VCF lock-in; Tomahawk 6 |
| C · Creative destruction | 10 / 15 | Custom AI accelerators displacing merchant GPUs inside hyperscalers |
| D · BlitzFailing | −5 | VMware pricing-litigation cluster; conditional customer financing packages (press-reported) |
Think we scored it wrong? Score it yourself →
Radar axes (0–100): Moat 60 · Speed 80 · Creative 67.
Watch item
Gates: G1 ✓ (sustained AI growth) · G2 borderline-pass (bar ≈ $891B vs TAM sum). 4 points below the threshold — first score. Interest coverage ~20×.
Strengths
- Q4 guidance $34.8B (+93% YoY)
- AI semi $16.7B → $21.7B ramp
- SW segment GP 93%
- $59B debt with ~20× interest coverage
Concerns
- G2 bar marginally covered
- Financing packages would double leverage if executed
- Regulatory pricing pressure
- Valuation ~1.9× bar (not scored)
Research notes
1. Thesis: A Mature Megacap in the Acceleration Phase of a Second Blitz
Broadcom Inc. enters this scoring period classified in the score file as a mature megacap, with trailing-twelve-month revenue of approximately $89.1 billion and a market capitalisation of approximately $1.65 trillion as reported in the press on 2026-10-14. Those two figures frame everything that follows, because the central tension of this assessment is the contrast between the size of the company and the speed at which it is currently growing. A business of this scale is not normally expected to accelerate. Broadcom, on the evidence available at T, is doing exactly that, and the acceleration is concentrated in one place: custom artificial intelligence silicon and the networking that connects it.
The score file records a total of 61 out of 100, grade B, four points below the 65-point threshold that BlitzLab treats as success. That position deserves to be read precisely. It is not a borderline failure caused by a single weak item, and it is not a near miss on one axis. Converted to the radar-chart axes used by the model, speed stands at 80.0 out of 100, creative destruction at 66.7, and moat at 60.0. Speed is therefore the strongest axis and moat the weakest, which is an unusual shape for a company of this size and history. The usual mature-company profile is a deep moat with fading speed. Broadcom presents the reverse: speed that would be remarkable for a company a tenth of its size, paired with a moat that is real but narrow, built on switching costs and bundling rather than on the self-reinforcing network effects that carry the highest moat marks in this model.
Both gates of the model pass, and the character of each pass matters. Gate 1 asks whether growth continues or a second growth curve exists. It passes on confirmed figures. Third-quarter fiscal 2026 revenue reached $29,591 million, up 85.5 percent year on year on a confirmed basis from the company's Securities and Exchange Commission (SEC) filing, while artificial intelligence semiconductor revenue reached $16.7 billion, up 221 percent year on year, also confirmed, marking a thirteenth consecutive quarter of growth in that line. Guidance for the fourth quarter of fiscal 2026, again confirmed from the SEC filing, points to approximately $34.8 billion, up 93 percent year on year. On top of that, the score file records six custom accelerator customers on a press-reported basis, including Google, Anthropic, Meta, and OpenAI, and an order backlog of approximately $110 billion, also press-reported. After the VMware integration, the software segment is contributing a stable 30 to 45 percent of revenue, and the second growth axis, custom artificial intelligence accelerators plus networking, is running. The score file describes this as a second blitz in progress, and the confirmed growth figures are what earn that description rather than merely decorating it.
Gate 2 asks whether the ten-year ceiling of the new market is at least ten times current revenue. Here the pass is explicitly borderline and rests on estimates, and the draft must keep that qualification attached to the conclusion. Ten times trailing-twelve-month revenue of approximately $89.1 billion sets a bar of approximately $891 billion. The data-centre artificial intelligence semiconductor market alone, estimated at $860 billion for 2030 by the Korea Export-Import Bank's Overseas Economic Research Institute on a press-reported basis, covers approximately 97 percent of that bar on its own. Adding artificial intelligence networking attach, estimated on a weak source at $0.40 to $0.60 of networking for every $1.00 of custom artificial intelligence spending, plus infrastructure software for private cloud built around VMware Cloud Foundation (VCF), takes the combined ceiling above the bar. The score file is candid about the fragility of that arithmetic: the market definitions may overlap, so summing them risks optimism bias, and the pass is therefore recorded as borderline. A reader who strips away the qualification and reports Gate 2 as a comfortable pass would be misrepresenting the score file. The honest summary is that the market is plausibly large enough, that the largest single estimate nearly reaches the bar by itself, and that the margin above the bar depends on combining markets whose boundaries are not cleanly separated.
The direction of travel recorded in the score file is rising, described as second-blitz acceleration. The test of that direction is unusually concrete and unusually near: whether fourth-quarter fiscal 2026 guidance of approximately $34.8 billion is achieved, and whether the artificial intelligence semiconductor trajectory from $16.7 billion toward an expected $21.7 billion continues. If it does, the score file expects the growth and market-size items to move upward. If the financing packages discussed below are confirmed, the debt item is expected to move in the opposite direction. The score of 61 is therefore best understood as a snapshot of a company mid-acceleration, with its largest upside and its largest downside both scheduled to be tested in the next quarter's evidence.
2. Speed: Exceptional Growth at Megacap Scale, Measured Without the Acquisition Effect
Speed scores 20 out of 25, and the composition of that subscore is where the score file does its most careful work. Growth itself earns 9 out of 10, one point short of the maximum, and the reasoning behind both the high mark and the withheld point should be followed in detail. The headline figures are confirmed: third-quarter fiscal 2026 revenue of $29,591 million, up 85.5 percent year on year, artificial intelligence semiconductor revenue of $16.7 billion, up 221 percent year on year across thirteen consecutive quarters of growth, and fourth-quarter guidance of approximately $34.8 billion, up 93 percent year on year. For a company with a trailing-twelve-month revenue base of approximately $89.1 billion, that combination of scale and acceleration is, in the score file's words, exceptional for a megacap. The withheld tenth point is a matter of base, not of doubt about the figures: at a base of approximately $89 billion, the model reserves the maximum for growth that is even less constrained by scale.
What makes the growth mark credible, rather than merely large, is a methodological decision that the score file applies explicitly and that this draft records because it changes how the numbers must be read. Fiscal 2024 revenue growth of 44 percent was driven mostly by the VMware acquisition, as the company's annual report management discussion states in terms the score file quotes as "primarily due to contributions from VMware," confirmed from the SEC filing. Under a candidate rule for the next version of the model, applied in advance in this scoring, acquisition-driven growth is separated out and growth is assessed on organic growth alone. On that organic basis, semiconductor growth moved from 7 percent in fiscal 2024 to 22 percent in fiscal 2025, both confirmed, before the artificial intelligence semiconductor surge of fiscal 2026. The 9 points are therefore not awarded for a revenue line inflated by an acquisition. They are awarded for an organic sequence that starts modestly, steepens, and then breaks upward, with the acquisition effect deliberately removed from the judgement. That separation is also why the score file can describe the second blitz as organic: the acquisition effect was exhausted in fiscal 2024, and the fiscal 2026 acceleration is led by organic artificial intelligence semiconductor growth.
Capital velocity earns 4 out of 5, and the evidence here mixes confirmed filings with press-reported market figures, a mixture the draft preserves. Access to capital is of the highest order, with a market capitalisation of approximately $1.65 trillion reported in the press on 2026-10-14. Share repurchases in the third quarter of fiscal 2026 totalled $8,450 million on a press-reported basis, against an authorised limit set in April 2025 at $10 billion, subsequently increased to $11 billion, plus a new $10 billion authorisation in March 2026, on a confirmed and press-reported mixed basis. The quarterly dividend of $0.65, on a press-reported basis, extends a record of fifteen consecutive years of annual increases. Just as important as the capacity to raise and return capital is the evidence that acquisition borrowing is being repaid from debt capacity and cash flow rather than from dilutive financing: the Term A-2 facility of $11,195 million has been repaid in full, confirmed from the SEC filing. The withheld point is not explained in the score file as a specific failure, and this draft does not invent one; the mark sits one below the maximum for a company whose capital access is at the top of the scale but whose repurchase and dividend figures rest partly on press reporting rather than entirely on confirmed filings.
Hiring and productivity earn 3 out of 5, the lowest speed item, and the reason is straightforward: this is not a hiring blitz. Headcount stood at approximately 33,000 employees in the fiscal 2025 annual report, confirmed, down from approximately 37,000 in fiscal 2024, as post-acquisition integration reduces the workforce. There is therefore no headcount-increase signal to reward. What tempers the deduction is productivity: revenue per employee of approximately $1.94 million, calculated from fiscal 2025 revenue divided by headcount and labelled as a calculation in the score file, is described as elite-level. The score file scores this conservatively at 3 precisely because the two signals point in opposite directions: elite output per person, but a shrinking headcount in a deliberate integration phase. A draft that reported only the productivity figure would overstate the item; a draft that reported only the headcount decline would understate it. Both facts belong together.
Share velocity earns 4 out of 5, and here almost everything rests on press reporting, which limits how firmly the conclusion can be stated. The custom artificial intelligence accelerator business counts six core customers on a press-reported basis, including Google, Anthropic, Meta, and OpenAI. The Google tensor processing unit contract has been extended to 2031 on a press-reported basis. A joint development programme with OpenAI covers 10 gigawatts over the second half of 2026 through 2029, also press-reported. Meta's MTIA expansion exceeds 1 gigawatt, again press-reported. On the networking side, the Tomahawk 6 switch, rated at 102.4 terabits and described on a press-reported basis as the industry's first to reach mass production in March 2026, anchors the claim that Broadcom is expanding share in artificial intelligence networking as well as in accelerators. Quarterly artificial intelligence semiconductor orders exceeded $30 billion in the second quarter of fiscal 2026, press-reported. The fifth point is withheld for a specific, named reason: no verified figure for custom application-specific integrated circuit market share was available, so the share claim cannot be completed with a confirmed number. The score file also notes, as an unconfirmed comparison point, that Nvidia held a 78.2 percent share in 2024, against which Broadcom's position cannot be precisely located. The 4 points therefore describe demonstrated customer and order momentum with an explicitly unverified market-share denominator, and this draft keeps that gap visible rather than filling it with an estimate presented as fact.
3. Moat: A Lock-In Moat, Not a Network-Effect Moat
Moat scores 36 out of 60, and its internal structure explains why the total stops at 61 despite speed of 20 out of 25. The moat is substantial in two of its four items and deliberately limited in the other two, and the limitation is conceptual rather than a matter of execution. Broadcom's advantages defend customers; they do not, on the score file's analysis, make the product better for every customer as each new customer arrives. That distinction is the organising idea of this section.
Network effects earn 7 out of 18, and the score file is explicit that genuine network effects are absent. Virtualisation, the foundation of the VMware business, is a standards-plus-switching-cost business, not a network business. The positive case is therefore framed as lock-in, and the evidence for lock-in is extensive, though press-reported throughout. More than 90 percent of the top 10,000 customers purchase VCF, according to chief executive Hock E. Tan in September 2025 on a press-reported basis. The product line has been unified into per-core subscription pricing, access on an à la carte basis has been blocked on a press-reported basis, and price increases of 100 to 300 percent have not produced a mass exodus, also press-reported. Gartner, as reported in the press, estimates that a full migration away takes more than three years. The score file places this ecosystem lock-in moat at the same level as the company coded NBIS, which also scores 7, and the comparison is instructive: both are moats that retain customers through cost and complexity of departure rather than through a flywheel that improves with scale. Seven points out of eighteen is therefore not a dismissal of the moat. It is a classification of its mechanism, and the classification carries a consequence that recurs in the risk section: a lock-in moat can be monetised aggressively, and aggressive monetisation is exactly what generates the litigation and regulatory pressure recorded under demerits.
Distribution scalability earns 9 out of 18, the second-highest moat item, and this is the one moat item that rests substantially on a confirmed filing. Broadcom sells through a direct sales organisation plus a selective distributor and channel-partner network, and distributors accounted for 48 percent of fiscal 2025 revenue, confirmed from the annual report. The score file places this in the same anchor band as Palantir's bootcamp-style model: high-cost but demonstrably repeatable at large scale. The dependence on paid selling is the reason the mark stops at 9. There is no viral spread and no platform ride in the evidence; expansion is demonstrated through repeated large-scale selling rather than through customers acquiring other customers at low marginal cost. A further limit is disclosure: sales and marketing expense is not separately disclosed, being included in selling, general and administrative expense, so the cost of that distribution cannot be isolated and verified, and the score file records that component as unconfirmed. Distribution at Broadcom is therefore best described as proven and expensive: it reaches the world's largest technology buyers repeatedly, and it does so through an organisation that must be paid for, not through a mechanism that spreads on its own.
Market size earns 10 out of 12, and it is the mirror image of the borderline Gate 2 judgement, now expressed as a scored item. The data-centre artificial intelligence semiconductor market is estimated at $860 billion for 2030, the artificial intelligence accelerator market at approximately $1 trillion or more for 2030, and the broader artificial intelligence market at $2 trillion to $3 trillion, all on an estimated and press-reported mixed basis. The score file's judgement is that multiple axes are open at once: custom accelerators, artificial intelligence networking, and infrastructure software. The withheld two points repeat the share-velocity caveat in market form: the maximum of 12 is reserved until share evidence is secured, which remains unconfirmed. The market is judged large enough and multi-directional enough for 10 points, but the claim that Broadcom will capture a verified portion of it cannot yet be completed from the available evidence.
Gross margin earns 10 out of 12, and this is the strongest single moat item in absolute terms, resting on the firmest evidence in the section. Third-quarter fiscal 2026 gross margin reached 69.1 percent and operating margin 53.9 percent, described as a record quarter and confirmed from SEC XBRL data. Fiscal 2025 annual gross margin was 67.8 percent and operating margin 39.9 percent, confirmed from the annual report, tracing a recovery curve after acquisition amortisation. Segment detail, on a press-reported basis from the second-quarter fiscal 2026 earnings call, puts semiconductor gross margin at approximately 70 percent with operating margin at 62 percent, and infrastructure software gross margin at 93 percent with operating margin at 79 percent. Those segment figures explain the shape of the company: a semiconductor business with elite margins, and a software business with margins that approach the economics of a pure subscription franchise. The withheld two points reflect the amortisation that remains from the VMware acquisition; the score file judges the margin structure elite for a megacap while noting that the acquisition's accounting shadow has not fully cleared. Read together, the moat section describes a company whose economics are excellent, whose markets are large, whose distribution is proven, and whose defensive mechanism is lock-in rather than network growth. That combination yields 36 out of 60: strong, but structurally capped below the levels reached by companies whose moats compound with each additional user.
4. Creative Destruction: Rewriting the Pricing Order of Virtualisation
Creative destruction scores 10 out of 15, and its three items describe a destruction that is real, ongoing, and bounded in scope. This is not the story of a challenger destroying an incumbent from outside. It is the story of an acquirer rewriting the commercial order of a market it bought, and then discovering that rewriting a pricing order creates both a moat and a set of adversaries.
The order being displaced earns 3 out of 5. After the VMware acquisition, the pricing order of the virtualisation market was reshaped: perpetual licences ended and the product line was unified into per-core subscription pricing under VCF, both on a press-reported basis. More than 90 percent of the top 10,000 customers purchase VCF, according to Tan on a press-reported basis, which indicates that the new order has been widely adopted rather than merely announced. The limit on the mark is the pace and breadth of substitution on the customer side. Substitute products, including Nutanix AHV and Proxmox among others, are targeting customers seeking to leave, on a press-reported basis, but Gartner, as reported in the press, forecasts that only approximately one-third of VMware workloads will move to other platforms by 2028. Displacement is therefore in progress but slow and limited in scope: the old perpetual-licence order has been replaced as Broadcom's commercial order, while the installed workloads themselves migrate only gradually. Three points capture that split between a completed pricing transition and an incomplete workload transition.
Irreversible behaviour change earns 4 out of 5, the highest creative-destruction item, and the evidence is structural rather than attitudinal. The standard contract structure runs for three years, according to Tan on a press-reported basis, and it is reinforced by the VCF bundle lock-in described above and by multi-year custom silicon contracts: the OpenAI programme of 10 gigawatts over the second half of 2026 through 2029, the Google tensor processing unit relationship extending to approximately 2031, and an Anthropic programme of 3.5 gigawatts from 2027 onward, all on a press-reported basis. Customers who sign three-year bundle contracts and multi-year silicon programmes are not making reversible experiments; they are committing infrastructure and product roadmaps over horizons that make reversal costly and slow. The withheld point has a precise cause: customer prepayments and remaining performance obligation figures are not disclosed, so the financial scale of that lock-in is unconfirmed. The direction of structural lock-in is judged certain, but its measurement is incomplete, and the score file refuses to award the maximum for a magnitude it cannot verify. That discipline is worth noting, because it is the same discipline that withholds the fifth point on share velocity and the final points on market size: wherever the score file cannot verify a magnitude, it says so and withholds the point.
Cost-structure change earns 3 out of 5, and the evidence here is the most concrete in the creative-destruction section because it includes confirmed filings. Headcount fell from approximately 37,000 to approximately 33,000, confirmed from the annual reports, with a reduction of more than 19,000 VMware employees on a press-reported basis. Infrastructure software gross margin reached 93 percent on a press-reported basis. Selling, general and administrative expense as a share of revenue fell from 9.6 percent in fiscal 2024 to 6.6 percent in fiscal 2025, confirmed from the annual report. Taken together, those figures demonstrate a post-acquisition redesign of the cost structure: fewer people, a higher-margin software mix, and a leaner overhead ratio. The limit on the mark is definitional. This is not demonstrated evidence of a collapse in unit compute cost of the kind that would score higher under the model's creative-destruction logic; it is margin expansion through software bundling. The score file records that the item is satisfied through that bundling route, at 3 points, rather than through the unit-cost route. The distinction matters for how the reader should interpret the company's efficiency story: Broadcom has become leaner and higher-margin by changing what it sells and how it charges for it, not by demonstrating that each unit of compute it delivers has become dramatically cheaper to produce.
5. Deductions and Risks: Light Interest, Heavy Headlines
Demerits total −5, well below the 15-point threshold that would trigger a FLAG in this model, and the score file accordingly records no FLAG. That absence should not be read as an absence of risk. It should be read as a statement about the kind of risk Broadcom carries: not balance-sheet distress, not governance failure, not accounting irregularity, but a concentrated customer structure, an aggressive monetisation strategy that generates legal opposition, and a conditional financing stack that could change the debt picture quickly if confirmed.
Debt earns −3 out of a possible −10, and the reasoning is a study in the difference between the size of a debt stock and the burden of servicing it. Total borrowings stood at $59,419 million at 2026-08-02, confirmed from SEC XBRL data, equal to approximately 0.67 times trailing-twelve-month revenue on an estimated basis. Cash stood at $23,975 million, confirmed, leaving net debt of approximately $35.4 billion on an estimated basis. Interest expense of $778 million per quarter, on a confirmed and press-reported mixed basis, equals approximately 0.05 times adjusted earnings before interest, tax, depreciation and amortisation, implying coverage of approximately 20 times. All debt covenants were being complied with, confirmed from the annual report. The judgement is therefore that the absolute debt is large but the interest burden is light, and −3 reflects a large stock with a light service cost rather than either a clean balance sheet or a distressed one. The score file also records, explicitly outside the score, a conditional commitment stack on a press-reported basis that could transform that judgement: a $60 billion debt package for Anthropic plus up to $42 billion in direct lending, and a financing push of more than $50 billion for OpenAI chips, the latter reported by the Wall Street Journal on 2026-10-07. If confirmed, borrowings would more than double, and the score file flags this as a next-quarter verification item, with the debt item potentially moving from −3 into a range of −6 to −8. This draft reports the stack exactly as the score file does, as press-reported and not reflected in the score, because presenting it as confirmed borrowing would overstate the current debt position, while omitting it would hide the single largest near-term downside to the score.
Revenue quality earns 0, and the zero is a positive finding rather than an absence of examination. No revenue restatement, auditor change, or audit-opinion issue appears in the disclosure history, confirmed. A reclassification in the fiscal 2025 annual report between products and subscriptions-and-services left total revenue unchanged and is explicitly recorded as not accounting misconduct, confirmed from the annual report. A fiscal 2025 corporate tax benefit of $397 million, recorded as a negative tax figure in the filing, was a one-time tax effect contributing to net income, confirmed from the annual report; the score file records it as a net-income quality observation item rather than a revenue-quality trigger. The distinction is deliberate: a one-time tax benefit affects the quality of reported profit, not the quality of reported revenue, and the model keeps those categories separate. A reader who conflated them would misstate the deduction.
Governance also earns 0. The company has a single class of common stock with no differential voting rights, confirmed from the definitive proxy statement filed 2026-03-02. The chief executive is Hock E. Tan, the board counts eight members, both confirmed from the same proxy statement, and the auditor is PricewaterhouseCoopers, confirmed. Insider ownership detail is unconfirmed, but no trigger arises from it. Among the demerit items, governance is therefore the cleanest: no dual-class structure, no identified governance trigger, and a conventional board and auditor configuration.
Regulation and social cost earn −2, and this is where the lock-in moat returns as a cost. The score file records a cluster of litigation connected to VMware pricing practices, all on a press-reported basis, with no fines or penalties confirmed. The cluster includes a settlement with AT&T in November 2024 on undisclosed terms; a copyright matter brought by Siemens against VMware in which discovery is in progress; a case brought by UnitedHealthcare filed in April 2025; a case brought by Fidelity filed on 2025-11-03; a Tesco matter in the United Kingdom; a Netherlands court order of 2025-06-27 requiring two years of exit support; and action by CISPE, including a suit seeking annulment of European Commission approval, a request for interim measures in March 2026, and a formal information request from the European Commission in February 2026. The deduction is minor, at −2, because no penalty has been confirmed, but it is not zero because a formal European Commission information request is in progress. The pattern is the point: the same pricing unification and bundle lock-in that earn moat and creative-destruction points generate a sustained stream of legal opposition from customers and competitors. The score file treats the two sides as opposite faces of the same decision, with creative destruction at 3 and regulation at −2 recording the same commercial strategy from two directions.
Beyond the scored demerits, the score file identifies a concentration risk that is not itself a demerit item but is described as the largest single failure point for this second blitz, and this draft gives it the prominence the score file gives it. In the score file's formulation, four customers effectively constitute the addressable market for the artificial intelligence semiconductor surge: Google, Anthropic, Meta, and OpenAI, whose custom silicon intentions effectively are artificial intelligence semiconductor revenue. If any one of those four decisions bends, through internalisation of chip design, a switch to a competitor, or a slowdown in capital expenditure, the 221 percent acceleration could reverse at a similar speed. The blitzscaling fit analysis in the score file makes the same point in structural terms. Broadcom's primary growth levers are capital and distribution through customers, because the custom accelerator customer is the hyperscaler itself: the customer's capital expenditure is, in effect, Broadcom's revenue. Its secondary lever is platform, in the form of the VCF private-cloud bundle sold by subscription. Its weak lever is network effects, for the reasons given in the moat section. The score file contrasts this with a neocloud model that builds with customers' money: Broadcom, in this framing, sells on customers' capital expenditure. That is the most powerful fuel available in the current artificial intelligence investment cycle, and it is also the sharpest single point of failure, because the fuel supply is controlled by a small number of decision-makers whose plans Broadcom does not control.
The speed-versus-efficiency trade-off in the score file reinforces the same reading. Broadcom bought speed with an acquisition and repaid it with efficiency: the $69 billion VMware acquisition's borrowing was repaid and restructured within two years while infrastructure software gross margin was lifted to 93 percent and the selling, general and administrative ratio fell from 9.6 percent to 6.6 percent. That first act, integration and efficiency improvement, is recorded as complete. The second act, artificial intelligence accelerators plus networking, is organic and accelerating. The risk is therefore not that the first act failed; it is that the second act, which is now the growth engine, depends on a small number of external capital-expenditure decisions continuing at their current pace and direction.
6. What to Watch
Several observable markers will determine whether this 61/B rises, stays level, or falls, and each of them is already named in the score file's evidence, so a reader can test this assessment against the next quarter's disclosures rather than against impressions formed after the fact. The first and most consequential marker is fourth-quarter fiscal 2026 revenue against guidance of approximately $34.8 billion, up 93 percent year on year, confirmed from the filing. The score file describes achievement of that guidance as effectively the whole of the next quarter's question, and the artificial intelligence semiconductor trajectory from $16.7 billion toward an expected $21.7 billion is the component to examine within it. If that trajectory continues, the score file expects the growth and market-size items to move upward; if it stalls, the rising direction recorded here will need to be revisited.
The second marker is the conditional financing stack. Confirmation or non-confirmation of the Anthropic package, reported as a $60 billion debt package plus up to $42 billion in direct lending, and of the OpenAI chip financing push of more than $50 billion reported by the Wall Street Journal on 2026-10-07, will determine whether total borrowings remain near the confirmed $59,419 million at 2026-08-02 or more than double. The score file's own provisional range for the debt item on confirmation is −6 to −8, against the current −3, which would by itself move the total from 61 toward the high fifties before any other item is considered. A reader tracking this company should therefore treat any filing that confirms, quantifies, or withdraws those packages as a scoring event, not merely as a financing headline.
The third marker is the Gate 2 borderline. The next quarter's evidence should be examined for any firmer market-size or share data that either resolves or deepens the current position, in which a $860 billion data-centre artificial intelligence semiconductor estimate for 2030, press-reported, covers approximately 97 percent of the approximately $891 billion bar on its own, and the remainder depends on summing markets whose definitions may overlap. A verified custom accelerator market-share figure would serve two purposes at once: it would remove the reason the fifth share-velocity point is withheld, and it would give the market-size item the share evidence whose absence currently withholds its final points. Until such a figure appears and is confirmed, both withholdings should be treated as open rather than as permanent ceilings.
The fourth marker is the litigation and regulatory cluster. The score file records no confirmed fines or penalties, and the current −2 rests on a European Commission information request being in progress alongside the filed cases and the Netherlands exit-support order. Any confirmed penalty, any escalation of the European Commission process, or any settlement on disclosed terms would convert a press-reported cluster into a confirmed cost and would require the regulation item to be re-examined. Conversely, a narrowing of the cluster without confirmed cost would support the current minor deduction. The direction of this marker runs opposite to the moat: the more aggressively the bundle is monetised, the stronger the lock-in revenue and the louder the legal opposition, so the two should be read together rather than in isolation.
The fifth marker is the VMware workload migration itself. Gartner's press-reported forecast that only approximately one-third of VMware workloads will move to other platforms by 2028 sets a slow baseline for substitution. Evidence that migration is running materially faster or slower than that forecast would refine the creative-destruction judgement, which currently rests on a completed pricing transition and an incomplete workload transition. Related to this is the disclosure gap on customer prepayments and remaining performance obligations: publication of those figures would convert the structural lock-in judgement, currently scored at 4 with its financial scale unconfirmed, into a measured magnitude, and could move the irreversible-behaviour-change item in either direction depending on what the figures show.
A final marker sits outside the score by design and should be kept outside it by the reader as well. The valuation note in the score file, excluded from the score, records a market capitalisation of approximately $1.65 trillion on a press-reported basis on 2026-10-14, equal to approximately 1.9 times the approximately $891 billion Gate 2 bar. The business score does not look at price, following the lesson from BlitzLab's earlier testing that a business score and a market price measure different things. The figure is recorded here, labelled as press-reported and excluded from the score, so that a reader who wishes to weigh the distance between a business ceiling and a price that already reflects a multiple of it can do so without confusing that weighing with the score itself. Broadcom at 61/B is, in the end, a portrait of a second blitz that is real, organic, and accelerating, defended by lock-in rather than by network effects, funded by customers' capital expenditure through a small number of very large relationships, and carrying a debt and litigation profile that is currently light but could change quickly if press-reported financing packages are confirmed. The next quarter's evidence, above all the fourth-quarter revenue outcome and the financing question, will show whether the acceleration phase extends or whether the concentration that powers it begins to bind.
Head-to-head
Broadcom vs NVIDIA — side-by-side scorecard comparison.
More AI Infra companies
Other AI Infra names on the Blitz Index, highest score first: NVIDIA (87/A), Arista Networks (73/B), Advanced Micro Devices (62/B).
Next earnings
Dec 9, 2026 · After close · Confirmed
Coverage
Broadcom Inc. · Q4 FY2026 due Dec 9, 2026 (AMC) · Score 61 · Grade B
Embed this score
Copy the HTML below to show this score on your site. The badge links back to this page and updates automatically when the score changes.
Preview:
BlitzLab scores businesses against a scholar’s standard — not investment advice. No price targets, no buy/sell recommendations. Figures are from SEC filings (XBRL) as labeled in the source scorecard.