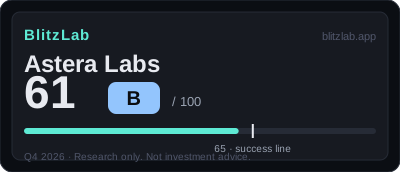
Astera Labs — Blitz Index 61 (B)
$34.8M → $852.5M in four years — a single unnamed customer is over 70% of it.
Last re-scored: November 3, 2026.
Confidence: High · Nasdaq-100 · Category: ai-infra
Score breakdown
| Section | Score | Detail |
|---|---|---|
| A · Speed | 20 / 25 | Q3 2026 $584.9M (+153.7% YoY); TTM $1.56B (+115.2%); A1 now 10/10 |
| B · Moat | 32 / 60 | Scorpio now the largest product family (Q3); bar $15.56B vs TAM 1.32× |
| C · Creative destruction | 10 / 15 | Connectivity fabric for the AI buildout — the bottleneck's bottleneck |
| D · BlitzFailing | −1 | Single end-customer >70%, top-3 ~86%, no minimum purchase; warrants contra-revenue 9M $30.4M |
Think we scored it wrong? Score it yourself →
Radar axes (0–100): Moat 53 · Speed 80 · Creative 67.
Watch item
Gates: G1 ✓ · G2 ✓ (borderline, TAM-estimated). 4 points below the threshold — Q3 2026 rescore (A1 9→10, B3 8→7). Zero long-term debt ($1.38B cash + securities) funds the fastest organic growth in the dataset.
Strengths
- Q3 2026 revenue $584.9M (+153.7% YoY, above guidance)
- Q4 2026 guidance $730–750M (FY2026 ~$2.02B, +137%)
- Gross margin 72.3% in Q3; GAAP operating margin 30.6%
- $1.38B cash + securities, zero long-term debt
Concerns
- Single end-customer >70% of revenue (unnamed, 10-K Item 1A)
- Top-3 customers ~86% — no minimum purchase commitments
- G2 clears the bar at only 1.32× estimated TAM (was 1.7×)
- Broadcom·Marvell·Credo among 7 named competitors
Research notes
1. Thesis: A Clean Explosion With a Single Point of Failure
Astera Labs, Inc. enters the BlitzLab assessment as a growth-stage company whose story can be stated in one sentence and whose risk can be stated in another. The story is an explosion: revenue rose from $34.8 million in fiscal 2021 to $852.5 million in fiscal 2025, a 24.5-fold increase over four years on figures confirmed in the company's annual report filed with the United States Securities and Exchange Commission (SEC), and the trailing twelve months to the third quarter of 2026 reached approximately $1,556 million, up 115.2 percent year on year on a calculation from reported figures. The third quarter itself produced revenue of $584.9 million, up 153.7 percent year on year and 49 percent sequentially, above the top of the guided range of $540 million to $560 million. The risk is concentration: in 2025 a single end customer accounted for more than 70 percent of revenue, and the score file records the top three end customers at approximately 86 percent, while the top five direct customers accounted for 84 percent, with no minimum purchase obligation in the master agreement. Those two sentences explain the whole score. Speed is very high, the balance sheet is unusually clean, the moat is real but discounted for concentration, and the total of 61 out of 100 sits four points below the 65-point threshold that BlitzLab treats as success. The grade is B, in the 60 to 79 band, and no flag applies, because total demerits of 1 fall far below the 15-point flag threshold.
The company's identity is part of the thesis. Astera Labs was founded in October 2017 in Delaware and listed on the Nasdaq on March 19, 2024, at an offering price of $36. It describes itself, in the annual report's business section, as an Intelligent Connectivity Platform for artificial intelligence infrastructure, selling the chips that move data between accelerators and the rest of the system: PCIe and CXL retimers, Ethernet smart cable modules, CXL memory controllers, and smart fabric switches. That description matters because it defines what kind of blitz this is. Astera Labs does not sell a consumer product, does not operate a marketplace, and does not own a data center fleet. It sells components into other companies' platforms, and its distribution is the design win: the decision by a hyperscaler or a system original equipment manufacturer (OEM) to build Astera Labs silicon into a platform generation. Once that decision is made, the component ships for as long as that platform generation lasts, and when the next generation arrives, the competition begins again. Everything in the score — the speed, the lock-in, the concentration, the margin — flows from that single mechanism.
The gate verdicts frame the assessment before any item score is considered. Gate 1, which asks whether growth continues or a second growth curve exists, passes on confirmed figures: the four-year revenue expansion, the second-quarter 2026 result, and the third-quarter 2026 result together satisfy the test, and the score file records three forms of product-market-fit evidence — explosive organic growth, a turn to profitability, and repeated design wins — of which at least two are present. Gate 2, which asks whether the ten-year market ceiling is at least ten times current revenue, passes on an estimate, and it is a borderline pass that deserves to be described honestly rather than smoothed over. Ten times trailing-twelve-month revenue of approximately $1,556 million sets a bar of approximately $15.56 billion. The narrow market for PCIe retimers alone, at approximately $0.6 billion in 2030 on a press-reported estimate from MarketPublishers, would fail that test on its own. The adopted market is broader: AI interconnect chips, covering optical digital signal processors plus retimers plus SerDes, estimated by DC Market Insights, in a press-reported estimate dated October 2026, at $9.88 billion in 2025 rising to approximately $20.6 billion in 2030 at a compound annual growth rate of 15.89 percent, which is approximately 1.32 times the bar, down from 1.7 times at the prior scoring date as revenue outgrew the estimate. A still broader networking and interconnect chip market of $31.86 billion in 2025, also a press-reported estimate cited in the score file, is approximately 2.05 times the bar. The score file is explicit that the company itself presents no total addressable market figure in its annual report or investor relations materials, so that part of the gate rests on press-reported estimates rather than on a company disclosure, and it labels the gate accordingly: a pass on an estimate, not a pass on confirmed figures. The reason the broader market is adopted at all is that the product mix has already moved beyond retimers: the company confirmed in its November 3, 2026 earnings release that the Scorpio smart fabric switch became its largest product family by revenue in the third quarter of 2026, and the score file applies the same adjacent-market summation precedent used in the Broadcom scoring. That is a judgment, recorded as such, and it is the first of several places where this assessment depends on a documented judgment rather than a single disclosed number.
On the three radar axes, the shape of the company is visible at a glance. Speed converts to 80.0 out of 100, moat to 53.3, and creative destruction to 66.7. Speed is the strongest axis by a wide margin, moat the weakest, and creative destruction sits between them. That shape is the opposite of a mature platform company, where moat usually leads, and it is characteristic of a component supplier in the middle of its first blitz: the growth is already demonstrated, the defensibility is still being built one design win at a time, and the destruction of the old order is under way but not complete. The score file's own summary phrase for this position is "a clean explosion," and the phrase earns its two halves equally. The explosion is clean because demerits total only 1 point, which the score file notes is among the lightest demerit totals in its measured set; the explosion is still an explosion, not a settled dominance, because four points of the gap to the 65-point threshold sit in moat, where concentration is discounted, and in speed, where no capital-raising activity exists to measure.
2. Speed: The Fastest Growth in the Measured Set, at Scale
Speed scores 20 out of 25, and its composition shows a company that is growing faster than almost anything else in the measured set while already operating at a revenue scale above $1 billion. Growth itself earns 10 out of 10, the highest single item score in this assessment, and the evidence behind it is unusually complete. Fiscal 2025 revenue of $852.5 million grew 115.1 percent, following growth of 242 percent in fiscal 2024 and 44.9 percent in fiscal 2023, all confirmed in the annual report. The second quarter of 2026 produced revenue of $392.4 million, up 104.4 percent year on year, confirmed in the quarterly report, and the third quarter accelerated further to $584.9 million, up 153.7 percent year on year and 49 percent sequentially, confirmed in the earnings release furnished as an exhibit to the November 3, 2026 current report — above the top of the guided range of $540 million to $560 million. Trailing-twelve-month revenue of approximately $1,556 million, up 115.2 percent year on year on a calculation from reported figures, and nine-month revenue of $1,285.7 million, up 120.9 percent year on year, carry the weight of the assessment. Fourth-quarter guidance of $730 million to $750 million implies full-year 2026 revenue of approximately $2.02 billion, up about 137 percent, on a guided basis. The score file's judgment is that the top mark, previously reserved until growth above 100 percent was demonstrated at a scale above $2 billion, is now met on the two bases the file itself named: the third quarter annualizes to $2.34 billion at 153.7 percent growth, and the full-year guidance clears $2 billion at about 137 percent. The question is no longer whether triple-digit growth survives the transition from a $1 billion company to a $2 billion company — the third quarter answered it — but whether it survives the next generation cycle, when the concentrated customer base decides again.
Capital velocity earns 3 out of 5, and the reasoning here is instructive about what the item does and does not measure. The company had an estimated market capitalization of approximately $52.4 billion as of October 15, 2026, on a press-reported basis, which places its access to capital in the highest tier: a company of that size can raise capital if it chooses to. But the item measures the speed of capital deployment as demonstrated by activity, and since the initial public offering in March 2024 the company has conducted no additional public offering, a fact confirmed in its filings. Subsequent increases in the share count have come from restricted stock units, options, and warrant exercises rather than from new offerings. With no capital-raising activity to measure, the score file applies the same treatment it applied to Datadog and awards 3, neither punishing the company for not raising money nor crediting it for access it has not used. This is a place where the score's conservatism is visible: a balance sheet holding $1,378 million in cash and marketable securities, confirmed in the November 3, 2026 earnings release, and generating nine-month operating cash flow of $341.5 million, does not need to raise capital, and the score does not pretend otherwise. It simply records that capital velocity, as defined by the model, cannot be demonstrated without activity, and it leaves the point on the table.
Hiring and productivity earn 3 out of 5 on a similar combination of an excellent level and an unverifiable rate. The company employed 756 people as of December 31, 2025, confirmed in the annual report. Dividing trailing-twelve-month revenue of approximately $1,556 million by that headcount gives revenue per employee of approximately $2.06 million, which the score file describes as among the best in its measured set and attributes to the structural leverage of the fabless semiconductor model: a company that designs chips but does not own fabrication plants can scale revenue without scaling a factory workforce. The discount from a higher mark is a disclosure limit, not a performance criticism. The time series of hiring speed is not disclosed, so the rate at which the workforce is growing cannot be verified, and the score file applies its conservative principle and holds the mark at 3. The same logic governs share velocity, which earns 4 out of 5. The annual report confirms that the end customers are principally hyperscalers and system OEMs, which is itself evidence of penetration into the customers that matter most in AI infrastructure. The company confirmed in its November 3, 2026 earnings release that the Scorpio fabric switch became the largest product family by revenue in the third quarter of 2026, which is evidence of category expansion realized rather than merely expected. The withheld point is again a measurement limit: no quantified market share figure is disclosed, so share gain cannot be converted into a verified number, and the score refuses to award the top mark on qualitative evidence alone. Across all four speed items, the pattern is consistent. Where the evidence is confirmed and quantified, the marks are high. Where the evidence is qualitative or undisclosed, the score stops one or two points short, and it says so.
3. Moat: Lock-In Without Network Effects, Discounted for Concentration
Moat scores 32 out of 60, and its internal structure is the most important part of this assessment, because it contains both the company's genuine defensibility and the single discount that keeps the total below the success threshold. Network effects earn 7 out of 18, and the reasoning begins with a structural fact about the business. A semiconductor component supplier does not possess a true network effect in the classic sense: each additional customer does not automatically make the product more valuable for every other customer, the way additional users improve a search engine or a marketplace. What Astera Labs possesses instead is the structural lock-in of the design win, which lasts for the life of a platform generation, plus the bundling of its COSMOS software stack, both confirmed in the annual report's business section. The score file places this in the anchor band for effects that exist but are weak, at the top of the 5 to 9 range, and at the same level as Nebius at 7. That placement is a classification, not a dismissal. Design-win lock-in is real defensibility: once a hyperscaler has designed a retimer or a fabric switch into a platform, qualified it, and built system software around it, switching mid-generation is expensive and disruptive. But it is also temporary defensibility, because it expires at the next platform generation, when the competition reopens. The score of 7 holds both halves of that truth, and the COSMOS software bundle is recorded with its own limit: the score file notes that neither the bundle's structure nor any revenue contribution from COSMOS is separately disclosed, so it cannot be scored as a standalone software moat.
Distribution scalability earns 8 out of 18, and here the concentration discount is applied explicitly. The distribution model itself is straightforward and confirmed in the annual report: direct sales to hyperscalers and system OEMs, supplemented by distributors handling fulfillment and logistics. Expansion repeats on the design-win cycle, generation by generation, as each new platform adoption carries the product into the next system. The discount factor is customer concentration, and the figures are stark. The annual report's risk section confirms that the top five direct customers accounted for 84 percent of 2025 revenue, and that a single end customer accounted for more than 70 percent. The score file separately records the top three end customers at approximately 86 percent. The two concentration figures describe different cuts of the customer base — direct customers on one side, end customers on the other — and the draft preserves that distinction rather than merging them into a single number, because the score file records them separately and the difference between a direct customer and the end customer behind it matters for how the risk is read. What unifies them is the contractual fact that the master agreement carries no minimum purchase obligation, also confirmed in the filings. Distribution, in other words, is chained to the decisions of a very small number of customers who are not contractually bound to buy. The score file applies the same explicit concentration treatment it applied to Galaxy Digital and Symbotic and holds the mark at 8. That is the single largest judgment in the moat section, and it is also the hinge of the entire score: without the concentration discount, the moat and the total would read very differently, and with it, the company sits four points short of the threshold.
Market size earns 7 out of 12, following directly from the Gate 2 analysis. The adopted AI interconnect chip market of approximately $20.6 billion in 2030 is approximately 1.32 times the approximately $15.56 billion bar, down from 1.7 times at the prior scoring date, which is a pass but not a comfortable one, and the market figure itself is a press-reported estimate from DC Market Insights rather than a company disclosure or a confirmed filing figure. The score file withholds the top marks for exactly those two reasons: the headroom above the bar has thinned further, and the estimate carries the press-reported label. Gross margin earns 10 out of 12, the highest moat item, and it is the counterweight to the concentration discount. Gross margin has held in a band of 72 to 79 percent, confirmed in XBRL data from the filings, excluding a one-time anomaly of 24.1 percent in the first quarter of 2023. Fiscal 2025 gross margin was 75.7 percent, second-quarter 2026 gross margin was 73.3 percent, and third-quarter 2026 gross margin was 72.3 percent. The quarterly report's management discussion confirms the direction of travel: a gentle decline driven by product mix moving toward hardware modules and by customer warrant deductions from revenue. GAAP operating margin reached 30.6 percent in the third quarter of 2026, up from 22.7 percent in the second quarter, and nine-month operating cash flow was $341.5 million with free cash flow of approximately $268 million. The score file notes that operating profitability is thicker than Datadog's at the same 10-point mark, but withholds the final two points because of the declining gross margin trend. The moat section, taken as a whole, therefore describes a company whose product economics are superb, whose market is large enough but only just, whose lock-in is real but generational, and whose distribution is powerful but concentrated. That is a coherent portrait, and it is also a portrait of a moat still under construction.
4. Creative Destruction: Replacing How AI Systems Connect
Creative destruction scores 10 out of 15, and its three items describe a company attacking a bottleneck rather than a consumer habit. The order being displaced earns 4 out of 5. The annual report's business section presents the Intelligent Connectivity Platform as the answer to the connectivity bottleneck in AI infrastructure: as accelerator clusters grow, the limits on bandwidth and scalability in the fabric connecting them become the binding constraint, and the existing distributed approach to connectivity is what Astera Labs' retimers, smart cable modules, memory controllers, and fabric switches are designed to replace. The score file judges this a displacement in progress, large in scale but not complete, and awards 4 rather than 5 for that reason. The distinction matters. A score of 5 would require the old order to be substantially displaced already; here, the displacement is under way in the newest AI platforms while the older connectivity approach continues elsewhere, and the Scorpio transition — from a retimer company to an AI fabric infrastructure company, in the score file's phrase — is the visible form of that displacement expanding. Scorpio did become the largest product family in the third quarter of 2026, as the company confirmed, so the displacement claim broadens from improving connections within a system to providing the fabric of the system itself, and that is the substance behind the Gate 2 market argument.
Irreversible behavior change earns 3 out of 5, and the reasoning is tied to the generational cycle. After a design win, the customer is locked in for the life of a platform generation, but no quantified switching cost is disclosed, and the score file labels that figure unconfirmed. The customer warrants add a second, ambiguous piece of evidence. Warrants issued in February 2026 carry a maximum fair value of $280 million, and deductions from revenue reached $30.4 million in the first nine months of 2026, against $4.0 million a year earlier, confirmed in the November 3, 2026 earnings release. Warrants are simultaneously evidence of demand incentive — a customer valuable enough to be offered equity-linked consideration — and evidence of customer bargaining power, since the consideration flows from supplier to customer rather than the other way around. At the next platform generation, the customer can choose again, so the behavior change is in progress rather than irreversible, and the score of 3 records exactly that intermediate state. Cost structure change also earns 3 out of 5, on the same pattern of real change with missing measurement. The fabless model keeps capital expenditure at approximately 4 percent of revenue — $37.5 million in fiscal 2025, confirmed in the filings — and gross margin in the 72 to 79 percent band is itself evidence of a cost structure very different from a capital-intensive manufacturer. But no measured figure for unit-cost collapse has been disclosed by the company, and the score file labels that item unconfirmed, so the mark stays at the middle of the scale. The creative destruction section as a whole is therefore consistent with the rest of the score: the direction is clear, the scale is large, and the verification stops one step short of the strongest claims.
5. Deductions and Risks: The Cleanest Balance Sheet in the Set, and the Risks It Cannot Hedge
Demerits total only −1, and the smallness of that number is itself one of the most distinctive facts in this assessment. Debt earns 0, and the evidence is unusually clean. Long-term debt is $0: the company has no borrowings and no interest expense, and it recorded interest income of $44.7 million in fiscal 2025, confirmed in the annual report. Total liabilities of $300.9 million, confirmed in the November 3, 2026 earnings release, equal approximately 0.19 times trailing-twelve-month revenue, and the score file notes that the entire amount consists of operating liabilities rather than borrowed money. Cash and marketable securities of $1,378.2 million, confirmed in the same release, complete a picture the score file contrasts directly with the neocloud companies CoreWeave and Nebius: while those companies build with borrowed money, Astera Labs earns from chips sold, funding expansion from operating cash flow rather than from leverage. No debt trigger applies, and the item is scored at zero without qualification.
Revenue quality also earns 0, with one item recorded for observation rather than deduction. There has been no revenue restatement, no auditor change, and no audit opinion issue, with PricewaterhouseCoopers as auditor since 2020, all confirmed in the filings. The item recorded for observation is the customer warrant deduction described above: $30.4 million in the first nine months of 2026, against $4.0 million a year earlier and a maximum fair value of $280 million. The score file treats this as a matter to record under revenue quality but not as a deduction trigger, and it separately flags the treatment of contra-revenue warrants as a candidate for a future version of the model, where a specific threshold for this kind of customer consideration could be defined. Regulation and social cost also earn 0. No securities class action is disclosed as of the as-of date, confirmed in the filings. The risk factors recorded in the annual report are noted rather than scored: competition described as extremely competitive, dependence on key management without key-person insurance, dependence on a single integrated circuit manufacturing partner, and export controls and tariffs affecting China. No confirmed regulatory issue exists, so no trigger applies.
Governance earns the only demerit, −1, and its cause is dilution rather than control. There is no dual-class voting structure: the company has a single class of common stock, confirmed in the definitive proxy statement and the annual report. The three founders — Mohan, Gajendra, and Morrison — are named in the filings by surname, and officers, directors, and 5 percent holders together hold approximately 37.9 percent, confirmed in the annual report. The deduction rests entirely on stock-based compensation: $160.0 million in fiscal 2025, equal to 18.8 percent of revenue, confirmed in the filings, with the prior year's 59.2 percent identified as a one-time effect of initial public offering vesting, 16.3 percent in the second quarter of 2026, and 15.2 percent of nine-month revenue in the first nine months of 2026, a declining share. Unrecognized restricted stock unit expense of $640.1 million indicates that dilution continues into future periods. The score file treats this as a mild, ongoing cost rather than a governance failure, and the −1 reflects that calibration: the governance structure itself is clean, but shareholders absorb a steady equity cost that cannot be ignored.
Stepping back from the item scores, the risk picture resolves into the score file's own central warning, which deserves to be stated plainly because it is the one risk that the clean balance sheet cannot offset. The single largest risk is that one customer is, in effect, the demand: a single end customer above 70 percent, no minimum purchase obligation, and the customer's identity not disclosed. If that customer's next-generation platform choice changes, triple-digit growth could evaporate within a design-win cycle that the score file puts at 12 to 18 months. A debt-free balance sheet, a $1,378 million cash and securities position, and a 30.6 percent operating margin do not hedge that risk, because the risk is not financial distress but demand disappearance. The other risks are real but secondary: competition from seven named competitors — Broadcom, Credo, Marvell, Microchip, Montage, Parade, and Rambus — in a market the annual report calls extremely competitive, with Broadcom competing directly in both retimers and fabric; dependence on a single manufacturing partner; dependence on key management without key-person insurance; and the gentle decline in gross margin as mix shifts toward hardware modules and warrant deductions accumulate. None of those, on the score file's evidence, threatens the score in the near term. The concentration risk does, and it is the risk a reader of this assessment should carry forward most seriously.
6. What to Watch
Several observable markers will determine whether this 61/B rises toward the 65-point threshold, stays level, or falls, and each of them is already named in the score file's evidence. The first marker has now been observed: the third-quarter 2026 result, reported after the market close on November 3, 2026, produced revenue of $584.9 million, above the guided range of $540 million to $560 million, with the Scorpio smart fabric switch confirmed as the largest product family and growth of 153.7 percent against the prior-year quarter. The next test is the fourth quarter, guided at $730 million to $750 million, which would put full-year 2026 revenue at approximately $2.02 billion. The second marker is the identity and behavior of the concentrated customer base. Any disclosure that names the largest end customer, quantifies its share more precisely, or changes the minimum purchase terms would convert the central risk from an anonymous concentration into a measurable relationship, and any loss or reduction of a design win at the next platform generation would be visible first in guidance rather than in reported revenue, because design wins precede shipments by a generation cycle.
The third marker is gross margin direction. The band of 72 to 79 percent has held, but the movement within it — 75.7 percent in fiscal 2025, 73.3 percent in the second quarter of 2026, 72.3 percent in the third quarter — points downward, driven by mix shift toward hardware modules and by warrant deductions. If the margin stabilizes as Scorpio scales, the withheld moat points become reachable; if it keeps declining, the question becomes whether operating margin and free cash flow margin can offset it, and the score file already records that tension in the gap between a 10-point gross margin mark and the withheld final two points. The fourth marker was the path to the $2 billion scale test embedded in the growth item: the top growth mark was reserved until growth above 100 percent was demonstrated at revenue above $2 billion, and the third quarter met it on a run-rate basis, moving speed to 20. The offsetting marker is now the market ceiling: the Gate 2 bar rose to approximately $15.56 billion while the adopted market estimate stayed at approximately $20.6 billion, so headroom thinned from 1.7 times to 1.32 times, and the moat item for market size fell one point. The fifth marker is disclosure on the items the score file could not verify: a quantified market share figure, a hiring time series, quantified switching costs, and a measured unit-cost figure would each convert a conservative mark into a verifiable one, in either direction.
Two further items sit outside the score but inside the reader's judgment, and the score file keeps them separate for a reason. The valuation note, which the model deliberately excludes from the score, records an estimated market capitalization of approximately $52.39 billion as of October 15, 2026, on a press-reported basis, a price-to-sales ratio of approximately 43.6 times trailing-twelve-month revenue of approximately $1.20 billion, a trailing price-to-earnings ratio of 148.75, and a forward price-to-earnings ratio of 53.75. The market capitalization is approximately 3.4 times the Gate 2 bar of approximately $15.56 billion and approximately 2.5 times the adopted 2030 market of approximately $20.6 billion, and the score file observes that the market appears to have priced in the product-mix expansion in advance. The business score does not look at price, following the lesson of BlitzLab's earlier testing that a business score and a market price measure different things, but a reader who cares about the distance between a business ceiling and a price that already reflects most of it will find those figures here, labeled as press-reported or calculated in the score file and kept separate from the score. Finally, the score file records three candidates for a future version of the model, none of which affects this score: a quantified anchor for customer concentration, a separate treatment for contra-revenue customer warrants, and a documentation rule for borderline Gate 2 cases where an adjacent-market summation carries the pass. Astera Labs is the new evidence case for all three, which is itself a sign of what this company contributes to the model: not only a score of 61/B, but a test of how the model should handle concentration, customer consideration, and borderline market ceilings the next time they appear. Astera Labs at 61/B is, in the end, a portrait of a company exploding cleanly and narrowly at the same time: debt-free, highly profitable, growing at triple digits past $1 billion, and dependent on a single customer's next decision for the continuation of all of it.
More AI Infra companies
Other AI Infra names on the Blitz Index, highest score first: NVIDIA (87/A), Arista Networks (73/B), Advanced Micro Devices (62/B).
Next earnings
Q4 2026 · Expected
Coverage
Astera Labs, Inc. · Q3 2026 reported Nov 3, 2026 · Score 61 · Grade B
Embed this score
Copy the HTML below to show this score on your site. The badge links back to this page and updates automatically when the score changes.
Preview:
BlitzLab scores businesses against a scholar’s standard — not investment advice. No price targets, no buy/sell recommendations. Figures are from SEC filings (XBRL) as labeled in the source scorecard.