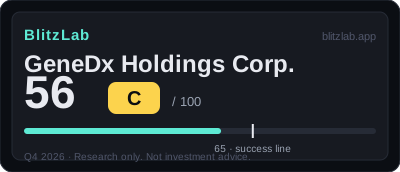
GeneDx Holdings Corp. — Blitz Index 56 (C)
GeneDx scores 56 — guidelines and Medicaid coverage built the distribution, genomic data builds the moat, and volume growth outruns revenue growth.
Last re-scored: October 25, 2026.
Confidence: High · Category: frontier
Score breakdown
| Section | Score | Detail |
|---|---|---|
| A · Speed | 16 / 25 | FY2024 +50.8% → FY2025 +40.0% → TTM +25.4%, but quarterly growth decelerated +17% → +11% while exome/genome volume grew +33% — ARR flat at $3,258 |
| B · Moat | 36 / 60 | Rare-disease genomic data flywheel (GeneDx Infinity) plus guideline-and-coverage distribution: AAP/ACMG first-line recommendations, Medicaid in 39 states, Epic ordering — payor groups A+B are 62% of revenue |
| C · Creative destruction | 11 / 15 | Exome/genome as the first test replacing the multi-year diagnostic odyssey of sequential single-gene and panel tests — institutionalised by guidelines, not yet complete (39 states, panels still $50.9M) |
| D · BlitzFailing | −7 | Adjusted profit (+$41.8M in 2025) vs GAAP loss (−$21.0M) gap, ~$55M Q1 2026 gap unexplained in the pack, plus reimbursement-policy dependence and $5.6M legal reserves |
Think we scored it wrong? Score it yourself →
Radar axes (0–100): Moat 60 · Speed 64 · Creative 73.3.
Watch item
Gates: G1 ✓ (confirmed) · G2 ✓ (borderline estimate — passes only if growth continues; bar ≈ $4.54B). 9 points below the threshold — first score.
Strengths
- Exome/genome volume +30.5% (2025) → +33.0% (H1 2026) — the blitz is in test count
- AAP and ACMG first-test recommendations plus Medicaid coverage in 39 states
- Adjusted gross margin 71.2% with operating cash flow turned positive in 2025
- Exome/genome now 43% of results (47% in Q4) — the mix shift is the story
- Epic Aura in-hospital ordering embeds the test in clinical workflow
Concerns
- Revenue growth decelerated +17% → +11% while volume grew +33% — ARR flat at $3,258
- FY2026 guidance cut $540–555M → $475–490M in Q1 2026
- Adjusted net income +$41.8M vs GAAP net loss −$21.0M in 2025 — the gap is the debate
- Two payor groups are 62% of revenue — reimbursement renegotiation is the speed limit
- Cash fell $38.8M in H1 2026 while the Blackstone facility was expanded to $150M
Research notes
Thesis: a guideline-driven blitz whose volume is still accelerating while its revenue is decelerating
GeneDx Holdings Corp., listed on NASDAQ under the ticker WGS, scores 56 out of 100 under the BlitzLab v1.0 model, grade C, made up of Speed 16 out of 25, Moat 36 out of 60, Creative Destruction 11 out of 15, and deductions of 7 points. The score is nine points below the 65-point threshold, and no FLAG applies, because total deductions of 7 fall below the 15-point FLAG trigger. This is a first scoring, scored as of 25 October 2026, on the basis of second-quarter 2026 results released on 3 August 2026. Third-quarter 2026 results, due on 9 November 2026 after the market close, fall after the as-of date and are excluded from the score; they appear in this draft only as a future marker, not as an anticipated outcome. The confidence level recorded in the score file is high, because the assessment rests mainly on confirmed figures from the SEC 10-K and company earnings releases, while call summaries and company claims are separated out as press-reported, and no verified third-party total addressable market figure was secured, so the market-size items are labelled estimates. GeneDx is classified as growth, on trailing-twelve-month revenue of $454.4 million. It was formerly Sema4 Holdings Corp., and the 2023 totals carry a discontinuity from the wind-down of the legacy Sema4 diagnostics business, which matters for any year-on-year comparison drawn from that year.
The thesis of this draft can be stated in one sentence, and everything that follows is an attempt to test it against the filings. GeneDx is a company whose distribution network is not a sales force or a platform in the software sense, but a set of institutions: medical guidelines that recommend its test first, Medicaid programmes that pay for it, and hospital ordering systems that make it easy to request. That institutional distribution is producing a genuine blitz in test volume, yet the revenue that volume generates is growing more slowly than the volume itself, and the profit that appears on an adjusted basis does not yet appear on a generally accepted accounting principles basis. The score of 56 describes that three-way tension precisely: a moat section at 60.0 on a 100-point scale, a speed section at 64.0, a creative-destruction section at 73.3, and deductions that are modest in total but concentrated in exactly the places where the tension is sharpest, namely debt dependence, earnings quality, and regulatory exposure.
Two features of the score deserve attention before any of the detail, because they explain the shape of the whole assessment. The first is that both gates pass, but the second gate passes only on a borderline basis and only on a condition. Gate G1, sustained growth or a second growth curve, passes on confirmed figures: continuing-operations revenue, exome and genome volumes, and exome and genome revenue all growing together over two full years and into the first half of 2026. Gate G2, a ten-year ceiling in a new market at least ten times current revenue, passes on an estimate and on a stated premise: the bar is approximately $4.54 billion, ten times trailing-twelve-month revenue of $454.4 million, and flat arithmetic on the 2025 revenue lines reaches only $4.27 billion, so the pass depends on growth continuing rather than stopping. The second feature is the gap between volume and revenue, which recurs in nearly every section of the score. Exome and genome volumes grew 30.5 percent in 2025 and 33.0 percent in the first half of 2026, while total revenue growth decelerated from 17 percent in the first quarter of 2026 to 11 percent in the second quarter, and average revenue per test was roughly flat. Whether that gap is a mix shift toward cheaper genome tests, as the company explains it, or the first sign of demand softening, is the central open question of the score, and the score file refuses to answer it on the available evidence. The draft follows that refusal: the gap is described, its two readings are stated, and neither is adopted as fact.
Speed: two years of high growth, then a visible deceleration in the most recent quarters
The speed section, 16 out of 25, converts to 64.0 on a 100-point scale. Its shape is a company that has already demonstrated the growth the blitzscaling model asks for, but whose most recent quarters show that growth slowing, and whose guidance has already been cut once to reflect the new pace.
Growth, scored 7 out of 10, rests on a two-year sequence that is confirmed in the filings. Total revenue rose from $202.6 million in 2023 to $305.5 million in 2024, up 50.8 percent, and then to $427.5 million in 2025, up 40.0 percent on the score file's labelling, with the file noting that a direct calculation gives 39.9 percent, a rounding difference. The 2023 total, however, includes the legacy Sema4 diagnostics business that was wound down, so on a continuing-operations basis the cleaner comparison is $194.4 million in 2023 rising to $302.3 million in 2024. The engine inside those totals is exome and genome testing: volumes rose from 49,439 tests in 2023 to 74,547 in 2024, up 50.8 percent, and then to 97,271 in 2025, up 30.5 percent, while exome and genome revenue rose from $233.5 million to $360.3 million in 2025, up 54.3 percent, reaching 84.3 percent of total revenue. The concentration is itself a finding: by 2025, GeneDx was, in revenue terms, essentially a single-engine company, with the exome and genome line carrying more than four-fifths of the business. In the first half of 2026, exome and genome volumes grew a further 33.0 percent, to 58,273 tests, so the volume blitz had not stopped at the as-of date.
The reason the growth subscore stops at 7 rather than rising to 8 is the quarterly deceleration and the guidance cut that accompanied it. Total revenue growth by quarter eased from 17 percent in the first quarter of 2026 to 11 percent in the second quarter, even as volumes grew 32 to 34 percent. Trailing-twelve-month revenue growth, at 25.4 percent from $362.3 million to $454.4 million, still looks strong in isolation, but it is a trailing measure that smooths over the most recent quarter's slower pace. Fiscal 2026 guidance for total revenue was cut from $540 to $555 million to $475 to $490 million, and then reaffirmed at the lower range, implying growth of 11.1 to 14.6 percent for the year. Guidance for the exome and genome line itself remained more ambitious, at revenue growth of at least 20 percent and volume growth of at least 30 percent, which is consistent with the volume story but sits awkwardly alongside the lower total-revenue range. Two years of growth at the 8-point level, in the score file's judgement, are discounted by one point for the deceleration and the cut. The score is therefore best read as a backward-looking grade with a forward-looking warning attached: the history justifies a high score, and the most recent quarters justify withholding the top of the range.
Capital velocity, scored 4 out of 5, is a story of demonstrated access to capital, with a funding mix that costs it the fifth point. In 2025 the company raised $46.7 million net from a public offering. On 3 August 2026, alongside the second-quarter results, it expanded its Blackstone loan facility to $150 million, adding a $50 million term loan, and completed a $5 million private placement to a Blackstone affiliate at $61.00 per share. That $61.00 figure is a transaction price, not an analyst target, and the score file is explicit on the distinction. Pro forma cash, on the company's own calculation, stood at approximately $188 million, built as $133.5 million plus $50 million plus $5 million. The limitation is visible on the other side of the same balance sheet: cash plus securities fell from $172.3 million at 31 December 2025 to $133.5 million at 30 June 2026, a decline of $38.8 million in six months, and the new funding came principally in the form of an expanded debt facility rather than equity. A company that can raise capital from both public markets and a major lender, and that holds pro forma cash of approximately $188 million against a business of this size, has demonstrated capital access; a company whose cash fell by $38.8 million in a half-year while it expanded a debt facility has also demonstrated capital dependence. The subscore of 4 holds both facts together.
Hiring and productivity, scored 2 out of 5, is the thinnest-evidenced item in the speed section, and the score file says so plainly. The headcount figure of 1,300 employees is press-reported, not confirmed in the score file's pack, and no time series of headcount change was secured, so neither a hiring blitz nor a productivity trend can be verified from confirmed figures. What can be confirmed is qualitative evidence of organisational expansion: a general paediatrics commercial team built in early 2026, and the appointment of Mark Gardner as President on 15 June 2026, a hire from Quest Diagnostics, where he had been a senior vice president. On the press-reported headcount, trailing-twelve-month revenue per employee calculates to approximately $0.35 million, but the score file labels that figure a reference value only, because its denominator is unconfirmed. The volume growth of 33.0 percent in the first half of 2026 was absorbed operationally, which earns the item some credit, but without confirmed hiring or productivity numbers the subscore is capped at 2. This is the score file's discipline at its most visible: where the evidence is not confirmed, the score does not rise to meet the narrative, however plausible the narrative may be.
Share-of-market momentum, scored 3 out of 5, is capped for a similar reason: no quantified market share figure was confirmed, the score file stating that independent verification was unavailable. The proxy evidence for share expansion, however, is strong, and it is the same institutional evidence that runs through the whole assessment. Medicaid paediatric outpatient coverage expanded from 30 states in the third quarter of 2024 to 39 states in the second quarter of 2026. The American Academy of Pediatrics recommended exome and genome sequencing as a first-line test for children with global developmental delay or intellectual disability in 2025, and the American College of Medical Genetics and Genomics had done the same for developmental delay and intellectual disability before the age of 18 in 2021. In the general paediatrics channel, newly created in early 2026, the company reported on its call its strongest quarterly growth to date, though the quantitative detail was not disclosed, so the claim is press-reported in character. Exome and genome tests reached 43 percent of total results in 2025, and 47 percent in the fourth quarter, a mix shift that is itself a form of share gain within the company's own test portfolio. The score file explicitly refuses to use the company's self-description as a rare-disease diagnostics leader as evidence, since it is the company's own expression rather than an independent measurement. Three points, on that basis, is a judgement that distribution is expanding through institutions, but that the share itself cannot be measured.
Moat: a real data flywheel, a genuinely institutional distribution network, and a margin trajectory that is the cleanest in the score
The moat section, 36 out of 60, converts to 60.0 on a 100-point scale. Its character is best described as a moat that is real but uneven: the gross margin trajectory is the strongest single trend in the score, the distribution network is unusually institutionalised for a company of this size, and the network effect, while real in mechanism, is small in monetisation and inconsistently measured.
Network effects, scored 8 out of 18, rest on a mechanism that the score file treats as real: every test adds variant-interpretation data, interpretation accuracy improves, and improved accuracy draws the next referral. The asset that embodies that mechanism is GeneDx Infinity, the company's rare-disease genomic dataset. The difficulty is measurement. The score file warns that the scale figures cannot be linked into a time series because their scope differs by point in time: more than 700,000 clinical exome and genome tests in 2024 and more than 750,000 in 2025, against a 10-K summary figure of more than 2.5 million total tests, of which more than 1 million were exome and genome. A reader who strings those figures together into a growth series would be inventing a trend the pack does not support, and this draft does not do so. Monetisation is also still small: data information revenue of $7.5 million and software and interpretation revenue of $3.4 million in 2025, together $10.9 million against total revenue of $427.5 million. Biopharma partnerships numbered 32 as of the second quarter of 2024, and that figure had not been updated in the pack since. The subscore of 8 places GeneDx above a company with no true network effect, on the grounds that the flywheel mechanism is real, but below the top of the range, because the numbers are inconsistent across time and the revenue the flywheel generates directly is still small. The data asset may be the company's deepest long-term advantage; on the disclosed evidence, it is not yet a revenue engine.
Distribution scalability, scored 11 out of 18, is the highest moat subscore, and it is the item where the institutional character of the business is most fully visible. The distribution network, in the score file's framing, is guidelines plus coverage plus ordering integration: the American Academy of Pediatrics recommendation of June 2025 and the American College of Medical Genetics and Genomics recommendation of 2021; Medicaid coverage in 39 states; Carelon outpatient genome coverage announced on 14 June 2026, which the company described as covering up to 56 million members, a company claim rather than an independently verified figure; Epic Aura integration for in-hospital ordering; and the newly created general paediatrics channel. That is, for a diagnostics company, an unusually complete distribution stack: the guideline tells the clinician what to order first, the payer agrees to pay for it, and the hospital system makes ordering it a matter of a few clicks. The limitation, and the reason the subscore stops at 11 rather than rising to 12 or above, is that this distribution expands by institutional grind, state by state and payer by payer, not at software-like zero marginal cost. Payor group A accounted for 23 percent of 2025 revenue and payor group B for 39 percent, so 62 percent of revenue flowed through two payer groups, and the 10-K's leading risk items include reimbursement shortfalls and price renegotiation. Distribution that depends on two payer groups' reimbursement decisions is distribution that can be slowed by renegotiation, and the score reflects that dependence directly.
Market size, scored 8 out of 12, is an estimate, and the score file is explicit that no verified third-party total addressable market figure was secured in the pack, so vendor total addressable market headlines are not used as the ceiling. The gate arithmetic is the evidence instead. Flat arithmetic on the 2025 exome and genome line of $360.3 million over ten years reaches $3.60 billion, below the $4.54 billion bar; adding the other 2025 lines flat, $67.2 million in total, comprising panels at $50.9 million, hereditary cancer at $5.4 million, data at $7.5 million, and software at $3.4 million, reaches $4.27 billion, still just below the bar. The gate therefore passes only if growth continues, and the score file lists the evidence that growth has continued: fiscal 2026 guidance for total revenue growth of 11.1 to 14.6 percent and exome and genome revenue growth of at least 20 percent, first-half volume growth of 33.0 percent, Medicaid coverage rising from 30 to 39 states, rapid genome testing in neonatal intensive care units in 17 states, the guideline recommendations, and the new general paediatrics channel. The upside cases that would extend the ceiling are also named, and they are specific rather than general: coverage expanding from 39 states toward all states, neonatal intensive care coverage expanding beyond 17 states, the general paediatrics channel maturing, newborn screening research through the GUARDIAN study of up to 100,000 participants, and prenatal trio whole-genome sequencing. The score file also records what it excluded: conference-summary-based press-reported figures for unmet need in neonatal intensive care, which the pack prohibited from being adopted as a market size. Eight points, on that basis, is a judgement that the ceiling is reachable but not comfortably so, and the score file places GeneDx in the same band as a comparable diagnostics company scored at 8 on a ceiling approximately 1.7 times its bar.
Gross margin, scored 9 out of 12, is the moat item with the cleanest trajectory in the entire score. Adjusted gross margin rose from 46 percent in 2023 to 65.1 percent in 2024 and 71.2 percent in 2025, an improvement of 25.2 percentage points in two years, while generally accepted accounting principles gross margin rose from 44.4 percent to 63.6 percent and then to 69.7 percent on the score file's calculation. In the second quarter of 2026, adjusted gross margin held at 70 percent and generally accepted gross margin at 68 percent, a plateau at a high level rather than a peak followed by a fall. The reason the subscore stops at 9 is what happens below the gross margin line. The generally accepted operating loss in 2025 was $13.1 million, general and administrative expense jumped from $104.5 million in 2024 to $150.8 million in 2025, and stock-based compensation jumped from $9.1 million to $32.2 million, or 7.5 percent of revenue. A gross margin of 71.2 percent that does not survive to operating profit is a real achievement with a real qualification, and the score file places GeneDx below a comparable company scored at 10 on a 70.1 percent gross margin combined with a positive operating margin of 11.2 percent. The margin story is therefore two stories at once: unit economics that have improved dramatically, and an overhead and compensation structure that has absorbed the improvement.
Creative destruction: replacing the diagnostic odyssey, one guideline at a time
The creative destruction section, 11 out of 15, converts to 73.3 on a 100-point scale, the highest of the three 100-point conversions. Its three items describe different stages of the same substitution: a disorder being replaced that is clearly identified, a behaviour change that is embedded in clinical workflow but not yet complete, and a cost-structure change that is visible in margins but not yet in the price the customer experiences.
The order being displaced, scored 4 out of 5, is the diagnostic odyssey: years of sequential single-gene and panel tests, and long periods undiagnosed, for children with rare disease. The replacement is exome or genome sequencing as a first-line test, and the evidence that the replacement is institutional rather than merely aspirational is the guideline record itself, with the American Academy of Pediatrics and the American College of Medical Genetics and Genomics both recommending the new order. The fifth point is withheld because the displacement is in progress rather than complete: other panels still generated $50.9 million in 2025, Medicaid coverage reaches 39 states rather than all of them, and the hereditary cancer line shrank from $15.4 million to $5.4 million, which is a withdrawal rather than evidence of displacement in its own right. A substitution that has been endorsed by the profession but not yet finished across the country is, on the score file's judgement, a 4 rather than a 5.
Irreversible behaviour change, scored 4 out of 5, follows from the same institutional embedding. Guideline inclusion, Medicaid coverage, and Epic hospital ordering integration together place the new test inside the clinical workflow, and reversing a workflow change of that kind would require a guideline revision or a coverage withdrawal, an institutional reversal rather than a change of habit by individual clinicians. The score file places GeneDx in the same band as a comparable company scored at 4 on guideline and Medicare inclusion. The fifth point is withheld for three stated reasons: testing is a one-off episode per patient rather than a repeated behaviour, coverage is incomplete at 39 states, and payer reimbursement terms can change. A behaviour that is embedded but episodic, and that depends on payers continuing to pay, is durable without being irreversible in the full sense.
Cost-structure change, scored 3 out of 5, is the weakest of the three creative-destruction items, and the reason is a gap between producer economics and customer experience. The producer-side evidence is strong: adjusted gross margin improved by 25.2 percentage points over two years, volumes scaled, ultra-rapid genome testing for neonatal and paediatric intensive care can return results in as little as 48 hours, and the Fabric Genomics acquisition added artificial-intelligence interpretation. What is missing is evidence of a cost collapse as the customer experiences it. Average revenue per test was approximately $3,300 in the first quarter of 2026 and $3,258 in the second quarter, which the company described as roughly flat, and the dollar unit cost per test itself was not disclosed. The company's explanation, that an expanding genome mix lowers average revenue per test, is not inconsistent with the flat figure, but it is an explanation rather than a measurement. Sequencing costs have fallen across the industry, which means the cost decline cannot be claimed as specific to GeneDx. Three points, on that basis, is a judgement that the cost structure has changed for the producer, but that a demonstrated collapse in the cost experienced by the payer or the patient has not been shown.
Deductions and risks: modest in total, concentrated in the exact places the thesis is thinnest
Total deductions are 7 points, below the FLAG threshold, but their composition matters more than their total, because each deduction maps onto a specific vulnerability in the thesis.
Debt, scored minus 3 out of minus 10, reflects low absolute leverage combined with visible funding dependence. Long-term debt net of current portions stood at $48.2 million at 31 December 2025, with long-term lease liabilities of $56.0 million recorded separately, total debt of $215.5 million against total assets of $523.7 million, and cash plus securities of $133.5 million at 30 June 2026, or approximately $188 million on a pro forma basis after the Blackstone expansion. Leverage at that level is not itself a constraint, which is why the deduction is only 3 points. The funding signal is the other half of the item: cash fell $38.8 million in the first half of 2026 while the Blackstone facility was expanded by $50 million, which the score file reads as the realisation of the 10-K's stated possibility of needing additional capital. Stock-based compensation of $32.2 million, or 7.5 percent of revenue and 3.5 times the prior year's $9.1 million, is a separate dilution axis recorded in the same item. The score file places GeneDx as heavier than a comparable company scored at minus 2 on a near-net-cash position, and the comparison is instructive: the debt itself is manageable, but the direction of travel in cash and in dilution is not.
Revenue quality, scored minus 2 out of minus 10, is the deduction that most directly qualifies the profit story. No restatement, auditor change, or audit-opinion issue was identified within the pack's review scope, and the score file is careful to state that scope limit. The deduction rests instead on a persistent and widening gap between adjusted and generally accepted figures: adjusted net income of positive $41.8 million in 2025 against a generally accepted net loss of $21.0 million, and a first-quarter 2026 gap of approximately $55 million, between a generally accepted net loss of $63.3 million and an adjusted net loss of $8.2 million, whose item-by-item breakdown was not confirmed in the pack and must not be asserted as a cause. Second-quarter 2026 adjusted net income of $0.4 million, down from $16.4 million in the prior-year period, shows how thin the adjusted profit had become by the as-of date. The score file is explicit that this deduction is a discount on the quality and sustainability of adjusted profit, not an allegation of accounting impropriety, and that stock-based compensation, already counted in the debt item, is not double-counted here. Cash generation provides a partial counterweight, with operating cash flow turning positive at $33.3 million in 2025 and calculated free cash flow at $14.3 million, the first year of cash generation on that basis, but one year of cash generation does not close a gap that has persisted across quarters.
Governance, scored 0 out of minus 5, records no confirmed trigger: no dual-class voting or controlling-shareholder flag was confirmed in the pack excerpts, the chief executive Katherine Stueland and chief financial officer Kevin Feeley leadership was stable on the 10-K signature basis, and the appointment of Mark Gardner as President on 15 June 2026 is recorded as an external professional hire. The score file adds two scope limits that this draft preserves: the pack was not a full-text comparison against the 10-K, so the absence of a trigger is not confirmed as definitive, and insider signals were outside the pack's scope and unreviewed. Zero, on that basis, means no trigger found, not a clean bill of health in any absolute sense.
Regulatory and social cost, scored minus 2 out of minus 5, records no confirmed fine or sanction, but a high structural exposure. The business depends on federal and state laboratory licences, on data-privacy rules, on artificial-intelligence interpretation regulation, and on fraud and abuse rules, all disclosed in the 10-K, and above all on reimbursement policy: the Centers for Medicare and Medicaid Services' Early and Periodic Screening, Diagnostic, and Treatment guidance of 2024 forms the background to the Medicaid coverage expansion, so a reversal in Medicaid policy would shake the distribution network and the revenue at the same time. Legal reserves of $5.6 million were recorded in 2025, and litigation-related costs were mentioned in the first quarter of 2026, but their content and scale were unconfirmed. Minus 2, on that basis, is the band for exposure without a realised outcome, plus an unconfirmed litigation item.
What to watch: the three questions the next scoring will turn on
The score file's own framing of the next chapter is unusually precise, and this draft adopts it rather than inventing a new one. Three questions will determine whether the score moves toward the threshold or away from it, and all three are observable in the ordinary course of future filings rather than matters of judgement about strategy.
The first question is whether the adjusted-to-generally-accepted gap narrows. That means a second year of demonstrated cash generation alongside a move toward generally accepted profitability, rather than a single quarter of thin adjusted profit. The score file names the variables directly: whether the gap between adjusted profit and the generally accepted loss closes, and whether cash generation is demonstrated for a second year. Until that happens, the profit story remains an adjusted-basis story, and the revenue-quality deduction has no reason to narrow.
The second question is whether average revenue per test recovers or stabilises at a level consistent with renewed revenue growth. Volume growth of 33.0 percent in the first half of 2026 against revenue growth of 11 percent in the second quarter is a gap that cannot persist indefinitely without changing the growth story, and the company's mix explanation, that genome expansion lowers average revenue, needs to be tested against the next quarters' figures rather than accepted as a permanent feature. If average revenue per test remains at approximately $3,258 while volumes continue to grow, the revenue growth rate will remain structurally below the volume growth rate, and the growth subscore will continue to carry its discount. If it recovers, the deceleration of the second quarter reads retrospectively as a mix transition rather than a demand signal.
The third question is whether coverage keeps expanding. Medicaid coverage at 39 states, rapid genome testing in neonatal intensive care units in 17 states, the general paediatrics channel in its first year, and the GUARDIAN newborn screening research of up to 100,000 participants are the concrete markers of the institutional blitz, and each has a next step that is countable: more states, more intensive-care units, a maturing channel, and research results. A stall in coverage expansion would matter more than a single quarter's volume figure, because coverage is the distribution network itself, and the distribution network is what the moat score depends on.
Two future markers, and only two, belong in this section as dates rather than outcomes. Third-quarter 2026 results are due on 9 November 2026 after the market close, and the score file records third-quarter guidance, given before the as-of date, of revenue of $122 to $124 million, 33,200 tests, and adjusted net income of approximately $2 million. Those guidance figures are reported here as a marker of what the company itself projected, with no anticipated outcome attached to them, and the results themselves are excluded from the score. Beyond that date, the items to watch are the ones named above: the earnings-quality gap, average revenue per test, and coverage expansion. The score of 56, nine points below the threshold, is best understood as a company whose institutional blitz is real, whose margins have improved dramatically, and whose profit, pricing, and payer dependence have not yet caught up with its volume. The next scoring will show which of those three catches up first.
More Frontier companies
Other Frontier names on the Blitz Index, highest score first: Rocket Lab (62/B), Tesla (62/B), Illumina, Inc. (61/B).
Next earnings
Nov 9, 2026 · After close · Confirmed
Coverage
GeneDx Holdings Corp. · Q3 2026 due Nov 9, 2026 (AMC, confirmed) · Score 56 · Grade C
Embed this score
Copy the HTML below to show this score on your site. The badge links back to this page and updates automatically when the score changes.
Preview:
BlitzLab scores businesses against a scholar’s standard — not investment advice. No price targets, no buy/sell recommendations. Figures are from SEC filings (XBRL) as labeled in the source scorecard.