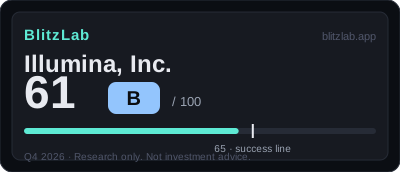
Illumina, Inc. — Blitz Index 61 (B)
Illumina scores 61 — the sequencing incumbent whose NovaSeq X transition and clinical engine just clear the B threshold.
Last re-scored: October 29, 2026.
Confidence: High · Category: frontier
Score breakdown
| Section | Score | Detail |
|---|---|---|
| A · Speed | 16 / 25 | TTM +4.9%, Q2 +9.4% (organic +6.5%), H1 +7.1% — fastest growth since the current CEO joined; FY2026 guidance raised to $4,600–4,640M |
| B · Moat | 40 / 60 | Installed-base razor/blade + DRAGEN/software ecosystem; NovaSeq X at 83% of high-throughput volumes, 78% of clinical volume; 66.1% FY2025 gross margin |
| C · Creative destruction | 12 / 15 | Sanger sequencing and microarrays displaced by high-throughput NGS; clinical ~65% of sequencing consumables and +~17% in H1 |
| D · BlitzFailing | −7 | China UEL listing + instrument-export ban (2025) with uncapped penalty range; GRAIL acquisition ended in EU-ordered divestiture and 2024 spin-off; gross debt ~$1.99B |
Think we scored it wrong? Score it yourself →
Radar axes (0–100): Moat 66.7 · Speed 64 · Creative 80.
Watch item
Gates: G1 ✓ (moderate pass) · G2 ✓ (estimate — bar ≈ $44.93B vs $35–70B genomics market plus clinical/multiomics wedge). 5 points below the threshold — first score.
Strengths
- Return to growth with breadth: Q2 +9.4% (organic +6.5%), instruments +31%, FY2026 guide raised to $4,600–4,640M
- NovaSeq X transition at scale: 83% of high-throughput volumes, 78% of clinical volume, 95+ Q2 placements
- Clinical engine: ~65% of sequencing consumables, +~17% in H1, U.S./Canada clinical >+20% in Q2 (press)
- GM 66.4% and rising; GAAP operating margin 21.1% in Q2; FCF $931M in FY2025
- Clean leverage: net debt ≈ $0.82B ex-leases; $1.0B CP program undrawn; S&P 500 inclusion Sep 2026
- Multiomics extension: SomaLogic (Jan 2026) + SpliceAI2 (Oct 2026) widen the moat beyond DNA reads
Concerns
- Two flat-to-down years precede the inflection; research demand remains funding-constrained with no recovery expected in 2026 (press)
- China: UEL listing + instrument-export ban, Greater China −$65M in 2025, ~7% of revenue at risk with uncapped penalty range
- GRAIL: the defining capital-allocation failure in scored history (spin-off 2024 after multi-billion impairments)
- Tariff drag + $23M intangible impairment hit 2025 margins; FY2026 adjusted margin guide (23.4–23.6%) still trails the Q2 GAAP trajectory's promise
Research notes
1. Thesis: A Mature Incumbent Whose Second Curve Has Inflected, Not Yet Proven
Illumina, Inc. enters this scoring period as a company that is easy to misread in either direction. Read only the most recent half-year, and it looks like a business back in motion. Read only the two years before it, and it looks like a business going sideways. The score file insists on holding both pictures at once, and the resulting total — 61 out of 100, grade B — is best understood as the arithmetic of that tension. The company passes both gates of the BlitzLab model, so scoring proceeds, but it finishes four points short of the 65-point threshold the model treats as success, and the score file is explicit that the position is fragile in a literal sense: two points of deductions or two points of speed in the other direction would change the grade. That fragility is not a flaw in the scoring; it is the finding. Illumina at T is a threshold company, and everything that follows should be read with that threshold in mind.
The classification recorded in the score file is "mature giant — second-curve test," and the terms matter. Trailing-twelve-month revenue is $4,493 million, and market capitalisation is approximately $40.7 billion on a press-reported basis. This is not a young company racing to establish a first market. Founded in 1998, Illumina is the dominant vendor of next-generation sequencing, the technology that reads DNA at scale, and its first curve — selling sequencing instruments and consumables principally to research laboratories — is mature. The question the scoring period asks is therefore a second-curve question: whether a new engine, clinical sequencing together with a multiomics extension, can succeed the research-led first curve rather than merely interrupt a decline. Gate 1 passes, but only as "confirmed, moderate," and the qualifier carries the whole thesis. Two flat-to-down years precede the inflection. Revenue was $4,584 million in fiscal 2022, $4,504 million in fiscal 2023, $4,372 million in fiscal 2024, and $4,343 million in fiscal 2025. Against that sequence, the first half of 2026 genuinely inflects: $2,250 million, up 7.1 percent year on year, with second-quarter revenue of $1,159 million, up 9.4 percent, and organic growth of 6.5 percent in the quarter. Trailing-twelve-month revenue of $4,493 million is up 4.9 percent against the prior trailing period. The score file also records, on a press-reported framing, that this is the fastest growth since the current chief executive joined. Yet the same file refuses to call one strong half a proven trend. A single half-year against two flat years is an inflection, not yet a trend, and research demand remains constrained by funding conditions. The thesis of this assessment is therefore conditional in form: a second curve has appeared, with a named engine and measurable breadth, but it has not yet compounded for long enough to be called established.
Gate 2 passes on an estimate, and the estimate deserves the same careful handling. The bar is ten times trailing-twelve-month revenue, or approximately $44.93 billion. The "new market" in question is clinical next-generation sequencing — oncology, reproductive health, and whole-genome applications — together with multiomics, meaning proteomics, genomic data, and artificial-intelligence services, beyond the legacy research core. Total genomics and next-generation sequencing market estimates span roughly $35 billion to $70 billion today depending on definition, on industry estimates at press level, growing at a high-single-digit percentage rate. On that basis, a ten-year ceiling above $44.93 billion requires only mid-single-digit sustained market growth before any share gain. The score file records the caveats alongside the pass, and they are material: the definition spread is wide, instrument exports to China are banned so that a region is removed from the addressable market by regulation, and research funding is constrained. A grader must not cite a single vendor total-addressable-market headline as the ceiling. Gate 2 therefore passes on total-market size while the addressable-share question remains open, and the market-size item later in the score reflects exactly that distinction.
2. Speed: Breadth, Not Explosion
Speed scores 16 out of 25, and its composition describes a large incumbent accelerating from a low base rather than a young company exploding. Growth itself earns 5 out of 10. The case for 5, rather than higher, is stated plainly in the score file: the base is a $4.5 billion incumbent coming off two down years, and even the raised guidance is single-digit to high-single-digit growth. Full-year 2026 guidance was raised to $4,600 million to $4,640 million, which is 6.4 percent growth at the midpoint against fiscal 2025. The case for 5, rather than lower, is breadth. The inflection is not a single-quarter artefact: instruments, consumables, and a raised guide move together, and the clinical engine inside the total — approximately 65 percent of sequencing consumables, up approximately 17 percent in the first half on a press-reported basis from the second-quarter call — is offset by flat research and a shrinking China rather than carried by one line alone. Instrument revenue rose 31 percent year on year in the second quarter, which corroborates the placement story discussed below. Speed at this level is therefore best read as recovery with breadth: real, broad, and still modest against the scale of the company producing it.
Capital speed earns 4 out of 5, on evidence of excellent access rather than blitz deployment. Free cash flow was $931 million in fiscal 2025, calculated from operating cash flow of $1,079 million less capital expenditure of $148 million in SEC filings, and $412 million in the first half of 2026. Cash plus short-term investments stood at approximately $1.17 billion on a press-reported basis. The share count fell from 159 million to 153 million on buybacks recorded in SEC filings. A new $1.0 billion commercial-paper programme, established in October 2026 with nothing drawn under it and confirmed in an SEC Form 8-K, and inclusion in the S&P 500 effective 21 September 2026 on a press-reported basis, further expand capital access. The fifth point is withheld for a reason that cuts to the character of the period: capital is being deployed partly to repair and to sustain a mature base — the SomaLogic acquisition, whose price is unconfirmed, is the named example — rather than to fund a blitz. Access is excellent; the velocity of deployment into new growth is moderate. That distinction between access and velocity is one the score file returns to, and it prevents a strong balance sheet from being mistaken for a blitzing one.
Hiring and productivity earn 3 out of 5, and share speed earns 4 out of 5, and the two items together describe an efficiency-led rather than headcount-led recovery. Revenue per employee is approximately $519,000, calculated as trailing-twelve-month revenue divided by a press-reported headcount of approximately 8,650 employees — solid for a hardware-plus-consumables incumbent. The 2024–2027 operational-excellence programme described in the fiscal 2025 Form 10-K management discussion is explicitly a productivity drive, and the margin evidence supports that reading: the GAAP operating margin rose from 18.6 percent to 21.1 percent in the second quarter. But no filing headcount series was extracted, so hiring velocity cannot be evidenced as blitz hiring, and the productivity story is margin- and cost-action-led rather than headcount-led. Three points therefore mean a productive incumbent, not a hiring blitz, and the score file says so directly. Share speed is stronger, because placement velocity is the share evidence. More than 95 NovaSeq X systems were placed in the second quarter alone, described on the call, on a press-reported basis, as part of three quarters of strong placements, with 83 percent of high-throughput volumes and 78 percent of clinical volume already transitioned. Instrument revenue up 31 percent year on year in the second quarter corroborates the conversion of the installed base rather than its mere defence. The fifth point is withheld because no filing-disclosed market-share percentage exists — press framings of a "dominant share" are not filing figures — and because share is simultaneously being lost in China by regulation, with Greater China revenue down $65 million in 2025 according to the Form 10-K. Placement velocity is real evidence of share momentum; it is not a measured share percentage, and the score keeps that gap visible.
3. Moat: An Installed Base That Pre-Sells Its Own Future
Moat scores 40 out of 60, the largest subscore in absolute terms, and its internal pattern is the most instructive part of this assessment. No single moat item reaches the top of its scale, and that restraint is deliberate. The moat here is installed-base razor and blade plus a data and software ecosystem, not a social network, and the score calibrates each item to that shape rather than to a platform ideal the company does not match.
Network effects earn 11 out of 18. The mechanism is instruments placed, followed by years of consumables pull-through, with validated clinical assays, DRAGEN pipelines, and reference data raising switching costs beyond contract terms. SpliceAI2, announced in October 2026 on a press-reported basis, and the SomaLogic proteomics acquisition extend that moat from DNA reads to multiomic interpretation. Eleven points sit above a pure hardware moat but below a true platform network effect, and the reason is stated with unusual clarity: there is no participant-side network externality in the classic sense, because each laboratory's value does not rise simply because another laboratory joins. Reference data and standards help at the margin, but the ecosystem premium is real and bounded. A reader who expects every successful technology company to possess a network effect will misread this item; the score file's point is that lock-in and ecosystem durability are not the same thing as a network effect, and Illumina has the former in strength and the latter only in bounded form.
Distribution scalability also earns 11 out of 18, and it scales through the installed base itself. Each NovaSeq X placement pre-sells years of consumables, and a direct-plus-distributor global footprint — direct sales in North America, Europe, Latin America, and Asia-Pacific, with distributors across Europe, Asia-Pacific, Latin America, the Middle East, and Africa — carries that pull-through. The second quarter's 95-plus placements are distribution speed made visible. The cap at 11 records two constrained channels: the China channel is impaired by regulation, through the Unreliable Entity List listing and the export ban discussed in the deductions section, and research-channel distribution is capped by customer capital conservatism and by National Institutes of Health funding cuts recorded in the Form 10-K management discussion. Two of the three historical channels are constrained even as the clinical channel accelerates. Distribution is therefore strong where it is growing and impaired where it is not, and the score holds both facts in a single number rather than averaging them away into optimism.
Market size earns 9 out of 12, following directly from Gate 2, and gross margin earns 9 out of 12, on confirmed filing figures. The market-size mark reflects a market that is sufficient but not overwhelmingly larger than the bar on every definition: the bar of approximately $44.93 billion is, the score file notes, the highest absolute bar among mature names scored this quarter, and the addressable slice is reduced by the China exclusion and by research funding constraints. The three points withheld from the maximum record that the opportunity is large enough without being so large that the bar becomes trivial. Gross margin is 66.1 percent in fiscal 2025, 66.4 percent in the second quarter of 2026, and 66.3 percent in the first half of 2026, all from SEC filings. The score file calibrates the item between two peers scored in the same system — a 63 percent margin scoring 8 and a 68 percent margin scoring 11 — placing Illumina just below the higher peer with a better trajectory, since margin is rising in 2026 after a tariff- and impairment-hit 2025. The points withheld record that 2025 gross margin fell year on year on tariffs plus a $23 million intangible impairment recorded in the Form 10-K management discussion, and that the consumables-mix benefit is partly offset by declining lower-margin partnership revenue. The margin is high-quality but not unpressured, and that final phrase is the right summary for the moat as a whole: strong, durable in its installed-base form, and carrying visible pressure at its edges.
4. Creative Destruction: The Incumbent as Its Own Destroyer
Creative destruction scores 12 out of 15, the highest section in proportional terms, and it is the reason this company reaches the B threshold at all. The score file makes the comparison explicit: creative destruction is what carries Illumina to 60 despite slower trailing-twelve-month growth than some lower-scored peers, because a self-cannibalising platform transition plus regulatory-grade lock-in is exactly what this section of the model rewards. Each of the three items earns 4 out of 5, and each withheld point marks a distinct reserve — for completion, for universality, or for a single-step collapse that has not occurred in this period — rather than a doubt about direction.
The order being replaced earns 4 out of 5. The replaced order is explicit and large: Sanger sequencing and microarrays for broad discovery, single-gene and panel diagnostics, and traditional diagnostic workflows, replaced by high-throughput next-generation sequencing as the default read-out, with clinical sequencing in oncology, reproductive health, and whole-genome applications as the still-expanding wave. The point withheld is the most interesting in the section, because Illumina is both incumbent and destroyer: NovaSeq X obsoletes its own prior platforms, which the score file calls the strongest form of self-cannibalisation evidence. The reserve is that the research replacement is already complete and therefore late-stage, while the clinical wave, though real, has not yet displaced traditional diagnostics at majority scale in most indications. A company canning its own installed base at scale is doing the hardest thing an incumbent can do; the score credits it without pretending the clinical displacement is finished.
Irreversible behaviour change also earns 4 out of 5. Once a laboratory validates a clinical assay on NovaSeq X chemistry and builds DRAGEN pipelines and reference data around it, reversion means revalidation, retraining, and data discontinuity. That is regulatory and operational irreversibility, not merely contractual lock-in. Clinical volume at 78 percent on NovaSeq X and clinical consumables up approximately 17 percent in the first half are the behavioural evidence. The withheld point marks the boundary of the claim: the change is deep within adopting laboratories and health systems, but it has not yet remade consumer or population-scale behaviour, and whole-genome clinical adoption is still expanding rather than universal. The score file's phrase for the maximum — smartphone-grade societal irreversibility — is deliberately demanding, and Illumina's change, however deep inside its adopting institutions, does not meet it. Cost-structure change earns the same 4 out of 5. The sequencing cost curve is the original cost-structure collapse of genomics, and NovaSeq X continues it through higher throughput per run, lower cost per genome, and the transition of 83 percent of high-throughput volumes onto the cheaper-per-unit platform. Artificial-intelligence interpretation extends the collapse from sequencing cost to interpretation cost: SpliceAI2 identified 17 percent more disease-relevant variants than competing models on a research dataset, on a press-reported basis. The withheld point records that the per-genome cost decline is a decades-long curve rather than a single-step collapse in this scoring period, and that tariff and impairment drags in 2025 show the cost structure can still move adversely. Taken together, the three items describe a destruction that is substantially accomplished in research, substantially underway in clinical applications, and still unfolding in cost — a mid-flight creative destruction, not a completed one.
5. Deductions and Risks: Regulation, Not Leverage, Is the Story
Demerits total −8, and their composition is the key to the entire assessment, because the shortfall against the 65-point threshold is smaller than the deductions themselves and the deductions are concentrated in exactly two places. No flag applies, since demerits of 8 sit below the 15-point flag threshold, but the absence of a flag should not be mistaken for the absence of risk. The score file's third key driver states the point directly: regulation, not leverage, is the deduction story.
Debt earns −2, a mild deduction, and the mildness is earned by the numbers. Gross debt is approximately $1.99 billion excluding leases at the second quarter, comprising a $500 million current portion plus $1.49 billion of long-term debt on a press-reported basis, equal to 0.44 times trailing-twelve-month revenue. Net debt is approximately $0.82 billion after approximately $1.17 billion of cash plus short-term investments, calculated, equal to 0.18 times trailing-twelve-month revenue. Operating cash flow of $1,079 million covers gross debt approximately 1.8 times on a cash-flow basis. The $1.0 billion commercial-paper programme, undrawn, is liquidity rather than debt. The deduction records two qualifications rather than a leverage problem: the $500 million current portion is a live refinancing item, and a press-reported "total debt" figure of $2.53 billion that includes approximately $0.56 billion of operating leases must not be confused with borrowing. Leverage is not the constraint here, but it is not zero either, and the score's −2 preserves that distinction.
Revenue quality earns 0, and the zero is a bounded finding rather than a sweeping clearance. No restatement for error, no fraud finding, and no material-weakness issue was identified in this pass of the SEC filings reviewed. The GRAIL-era impairments were disclosed impairments, not restatements, and the score file is careful not to double-count them here: they are graded under governance, not again as revenue-quality failures. The caveat is recorded with equal care: the auditor's identity was not extracted in this pass, so a "clean audit" is not asserted beyond "no finding in this pass." A zero that is honestly bounded in this way is more informative than a zero presented as a guarantee, and the assessment preserves the boundary.
Governance earns −3, the joint-largest single deduction, and it is historical in a way the model refuses to forget. The defining governance fact in scored history is the GRAIL acquisition of 2021, at approximately $7 billion to $8 billion in scale on a press-reported basis, which ended in a European Union-ordered divestiture and a spin-off on 24 June 2024 after years of losses and multi-billion impairments, followed by activist pressure in a 2023 proxy fight on a press-reported basis and a change of chief executive. Current leadership, under Thaysen since 2023, and the board refresh are post-crisis, and no super-voting class is disclosed on the Form 8-K cover. But the frozen model does not zero-weight a capital-allocation failure of this scale merely because it predates the current year. The deduction is material rather than maximum precisely because the failure is historical and the remediation — the spin-off, the refocus, and the return to growth — is evidenced. The score file also records, as a model question for a future version rather than as a scored claim, that the anchor should state how many years a spun-off failure continues to weigh on governance, so that a deduction of this kind has a defined half-life rather than an ad-hoc one. That open question is worth carrying forward, because it determines whether this −3 fades on a schedule or lingers by judgement.
Regulation and social cost earn the other −3, and this is the live deduction rather than the historical one. The costs are filing-named and current: the China Unreliable Entity List listing dated 4 February 2025, plus an instrument-export ban notice dated 4 March 2025, with potential fines and personnel and investment restrictions under the listing's provisions; Greater China revenue down $65 million in 2025 according to the Form 10-K; China at approximately 7 percent of revenue, or approximately $290 million, on a press-reported basis, and declining for three years. Alongside China sit National Institutes of Health funding reductions and grant cancellations, tariffs that dragged on 2025 margins, and Russia sanctions, all recorded in the Form 10-K management discussion. The deduction stops short of a realised-penalty score because no fine amount has been booked or quantified in the filings reviewed, and the penalty range remains uncapped. That uncapped range is the live tail on this score. The score file's blitzscaling analysis names it as the single biggest blitzscaling risk, in a formulation worth preserving: a moat built on global placement is only as strong as the most restrictive jurisdiction it depends on, and the China case proved that a regulator can delete a region from the addressable market overnight, while funding cuts show the same logic operating domestically through customer budgets. Regulation as a moat-breaker, rather than regulation as a compliance cost, is the risk this deduction prices.
The blitzscaling fit that emerges from these items is a platform-plus-validation incumbent running a second curve. The primary lever is the platform itself: the instrument is the platform, consumables are the toll, and DRAGEN, SpliceAI2, and now proteomics form the software and data layer that raises the toll's durability. The secondary lever is distribution through validation: clinical validation — assays, guidelines, and reimbursement pathways — is the distribution moat, because once a workflow is validated, the workflow is the channel. The weak lever is the network effect in the strong sense, for the reason given in the moat section. The speed-versus-efficiency trade-off has a visible scar. The company paid for the GRAIL detour with years of speed, then bought efficiency back through the 2024–2027 plan — return to growth plus margin expansion by the end of 2027, operational excellence, cost actions, the spin-off of the cash-burning GRAIL unit, and buybacks — so that growth in 2026 is efficiency-funded growth: placements and consumables, not headcount or acquisition splurges, SomaLogic excepted at an unconfirmed price. Profitability has returned on the filed numbers, with net income of $850 million in fiscal 2025 and a 21.1 percent GAAP operating margin in the second quarter of 2026, but the score charges the GRAIL years in governance because blitzscaling theory treats capital-allocation discipline as part of strategy rather than as a sunk cost to forget. The stage judgement follows: a mature incumbent in a second-curve acceleration attempt, with every marker of maturity — $4.5 billion of revenue, a 66 percent gross margin, approximately $0.9 billion of free cash flow, S&P 500 membership — and a second curve that has inflected but has not yet compounded for a full year.
6. What to Watch
Several observable markers will determine whether this 61/B rises, stays level, or falls, and each is already named in the score file's evidence. The first is durability. If the second half of 2026 and fiscal 2027 hold the second quarter's pace, the classification firms up as a second blitz; if growth fades back to low-single-digit, the correct label reverts to a mature cash franchise that had a good half. The raised full-year 2026 guidance of $4,600 million to $4,640 million is the near-term yardstick for that test, and the split inside the total matters as much as the total itself: whether the clinical engine, at approximately 65 percent of sequencing consumables and up approximately 17 percent in the first half, continues to outrun flat research and a shrinking China, or whether the constraints reassert themselves. The second marker is the NovaSeq X transition itself. With 83 percent of high-throughput volumes and 78 percent of clinical volume already converted, the remaining question is what the tail of the transition yields — whether placements continue at the second quarter's pace of more than 95 systems and whether consumables pull-through follows placements on the timetable the razor-and-blade model implies. A transition that is mostly complete has less incremental conversion left to drive growth, which is why the durability question and the transition question are the same question viewed from two sides.
The third marker is China, and it is the only one with an uncapped downside in the score file. Any quantification of a fine, any change in the export ban, or any further movement in the approximately 7 percent of revenue that China represents would move the regulation item before it moved anything else, and the score file's warning that the penalty range is still unquantified should be kept in view whenever the China line is discussed. The fourth marker is the margin trajectory against its own guide. Fiscal 2026 adjusted margin guidance of 23.4 to 23.6 percent still trails the promise of the second quarter's GAAP trajectory, and the tariff and impairment drags that hit 2025 margins are a reminder that the cost structure can move adversely even while the gross margin rises. The fifth marker is the multiomics extension. SomaLogic, acquired on 30 January 2026, and SpliceAI2, announced in October 2026, widen the moat beyond DNA reads, but the acquisition price is unconfirmed and the interpretation benefit is so far evidenced on a research dataset; whether proteomics and interpretation become a second toll comparable to sequencing consumables, or remain an extension to the existing toll, is a question for future scoring periods rather than a claim this one can settle. Finally, the calendar marker that frames all of these: third-quarter 2026 earnings are due after the market close on 29 October 2026, on a confirmed basis, and fall after this assessment's as-of date of 25 October 2026. They are therefore excluded from this score, and this draft anticipates nothing about their outcome. When they arrive, they will be the first new evidence on whether the inflection documented here extends into a second consecutive strong half — the minimum the score file's own logic requires before an inflection can be called a trend.
On the radar conversion the model publishes alongside the total, moat converts to 66.7, speed to 64.0, and creative destruction to 80.0 on a 100-point scale. Those three numbers summarise the assessment in miniature: a company whose capacity to destroy an old order, including its own, is its strongest trait; whose moat and speed are solid without being exceptional; and whose deductions, concentrated in one historical governance failure and one live regulatory exposure, are what hold a genuinely inflecting business four points below the threshold. The next scoring period will not need a new theory of Illumina. It will need a second half that looks like the first, a China line that stops deteriorating, and a multiomics story that converts from acquisition and announcement into measured pull-through. Until then, 61/B is a precise description of where the evidence stops: a second curve, inflected, unproven, and worth watching on exactly the markers named here.
More Frontier companies
Other Frontier names on the Blitz Index, highest score first: Rocket Lab (62/B), Tesla (62/B), SpaceX (60/B).
Next earnings
Q4 2026 · Expected
Coverage
Illumina, Inc. · Q3 2026 earnings Oct 29, 2026 (AMC, confirmed) · Score 61 · Grade B
Embed this score
Copy the HTML below to show this score on your site. The badge links back to this page and updates automatically when the score changes.
Preview:
BlitzLab scores businesses against a scholar’s standard — not investment advice. No price targets, no buy/sell recommendations. Figures are from SEC filings (XBRL) as labeled in the source scorecard.