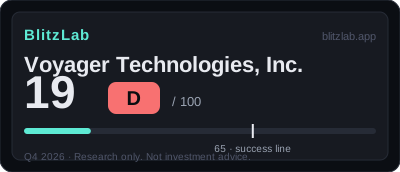
Voyager Technologies, Inc. — Blitz Index 19 (D)
Voyager scores 19 — record orders ($113.0M bookings, 2.1x book-to-bill) against a collapsing gross margin (8.4%) and 20 points of demerits.
Last re-scored: November 2, 2026.
Confidence: High · Category: frontier
Score breakdown
| Section | Score | Detail |
|---|---|---|
| A · Speed | 14 / 25 | Q3 2026 revenue $88.7M (+124.1% YoY, record quarter); bookings $116M (record) and backlog $742M (record) — the first half of the H2 acceleration is realised |
| B · Moat | 18 / 60 | No user-side network effect; heritage (1,400+ ISS missions) and the Starlab JV ecosystem are real but pre-revenue — no flywheel yet |
| C · Creative destruction | 7 / 15 | Positioned inside the official ISS-replacement process (Starlab) and commercial lunar logistics (Griffin) — but replacement has not occurred |
| D · BlitzFailing | −20 | ⚠️ BlitzFailing watch: debt + burn (D1 −8) · margin collapse and EAC charges (D2 −4) · CEO ~61% voting control (D3 −4) · 93.2% U.S. Government revenue (D4 −4) |
Think we scored it wrong? Score it yourself →
Radar axes (0–100): Moat 30 · Speed 56 · Creative 46.7.
Watch item
⚠️ BlitzFailing watch (D −20). Gates: G1 ✓ (weak pass — growth is real and continuing) · G2 ✓ (borderline — three-part wedge, depends on two pre-revenue programs). 46 points below the threshold — Q3 2026 rescore.
Strengths
- Q2 bookings $113.0M (record, 2.1x) + backlog $335.5M (record, funded $189.0M) — demand visibility is real
- Golden Dome $84.3M in Q2 + an Agentic AI spectrum-dominance award — inside current defense priorities
- Griffin-1 acceptance testing passed (2026-10-13; 10 payloads, 6 countries incl. NASA and ESA) — last ground gate before a late-2026 launch target
- Starlab JV ecosystem (Airbus, Mitsubishi, MDA, Palantir) + NASA ISS-replacement selection + SpaceX Starship launch contract
- Capital access: IPO $402M → 0% converts $402.5M (2032) → $250M revolver + shelf — liquidity itself is secured
- FY2026 guidance $285–305M (+72–84%) — the acceleration the company claims is blitz-scale
Concerns
- Gross margin collapse: 18.0% → 8.4% (Q2), Q1 −4.4%, H1 3.3% — fixed-price mix 59.3% with unfavorable EAC adjustments (−$11.7M H1)
- Burn: H1 FCF −$139.6M, Q2 alone −$72.8M — the September $402.5M raise bought time, not sustainability
- Guidance achievability: H2 needs $187–217M (+117–152% YoY) — Astrobotic contribution and backlog conversion undisclosed
- Single buyer: 93.2% of Q2 revenue and 87.7% of funded backlog from the U.S. Government; contracts terminable for convenience
- Governance: CEO ~61% voting power on ~9.4% of shares; controlled-company exception; classified board; CEO also Chairman
- Two binary bets: Griffin landing failure or Starlab Phase II loss would narrow the G2 path at once
Research notes
Voyager Technologies, Inc. (NYSE: VOYG) scores 19 out of 100 under the BlitzLab v1.0 model, a grade of D, 46 points below the 65-point line. The section scores are Speed 14 out of 25, Moat 18 out of 60, Creative Destruction 7 out of 15, and Deductions of minus 20, which triggers a FLAG because total deductions reach the 15-point FLAG line. Both gates pass, but both pass narrowly: G1, sustained growth or a second curve, passes on the strength of orders rather than on profitability, and G2, a ten-year market ceiling at least ten times current revenue, passes only on an estimated three-part wedge, not on a company-disclosed market size. The score file, dated to an as-of date of October 24, 2026, is the company's first scored quarter in this series. Voyager was founded in 2019, listed on the NYSE on June 11, 2025, and had therefore been listed for only about sixteen months at the as-of date, with roughly five quarters of listed reporting behind it. That short listed history matters for everything that follows: the evidence base is a young public record, built substantially through acquisition, and the score reflects that youth as much as it reflects any single quarter.
Thesis: orders are blitz-like, economics are running the other way
The central tension in Voyager's score is stated plainly in the score file, and it is the whole story in one sentence: demand looks like blitz, while unit economics are moving in reverse. In the second quarter of 2026, Voyager recorded bookings of $113.0 million, a record, at a book-to-bill ratio of 2.1 times, and a backlog of $335.5 million, also a record, of which $189.0 million was funded. Within the quarter's bookings sat $84.3 million of Golden Dome awards, alongside an Agentic AI spectrum-dominance award whose value was not disclosed. The company also raised its full-year 2026 guidance to $285–305 million, which the company presents as growth of 72–84 percent year on year. If the demand side of the record stood alone, this would read as a company accelerating into its market.
The realised revenue and profit record tells a different story, and the score keeps the two apart rather than letting one excuse the other. Revenue for full-year 2025 was $166.419 million, up 15.4 percent from $144.180 million in full-year 2024, and trailing-twelve-month revenue at the as-of date was $174.230 million. Second-quarter 2026 revenue was $52.746 million, up 15.5 percent year on year and described by the company as approximately 51 percent higher than the prior quarter, against a computed quarter-on-quarter figure of 49.6 percent from XBRL data. It was a record quarter, and because the Astrobotic acquisition closed on July 10, 2026, after the quarter ended, that growth is not an acquisition-consolidation artefact. But the quarterly path is volatile — $39.587 million in the third quarter of 2025, $46.651 million in the fourth, $35.246 million in the first quarter of 2026, then $52.746 million — and mid-teens year-on-year growth is sustained growth, not blitz-rate growth. The score file's judgement is that the gate for sustained growth passes weakly, on two consecutive years at around 15 percent plus record orders, and explicitly not as a blitz pass.
What makes the tension structural rather than incidental is that the margin collapsed in the same quarter that orders set records. Gross margin in the second quarter of 2026 was 8.4 percent, or $4.457 million, against 18.0 percent a year earlier; the first quarter of 2026 had been negative at minus 4.4 percent, or minus $1.546 million; and first-half 2026 gross margin was 3.3 percent, or $2.911 million. Core segment Adjusted EBITDA moved from positive $0.498 million in the second quarter of 2025 to negative $9.985 million in the second quarter of 2026, despite revenue growth of 15.5 percent, and consolidated Adjusted EBITDA was negative $37.500 million. The score file's framing is deliberate: under the frozen v1.0 model, the growth gate asks about sustained growth or a second curve, not about profitability, so margin and cash burn are scored in the moat and deduction sections rather than being smuggled into the gate. A reader who wants the short version can take the score file's own summary phrase: an order blitz with margins running in reverse, where each new order can enlarge fixed-price cost risk rather than proving that the business scales profitably.
Speed: fast access to capital, fast orders, mid-teens realised growth
Speed scores 14 out of 25, the strongest of the three positive sections on a percentage basis, and its composition shows why. Growth itself, item A1, scores 5 out of 10: the first half of the H2 acceleration is now realised (Q3 revenue +124.1% YoY), with the second half still unproven. The acceleration claim is the guidance, and the score file is careful to show its size and its burden. Guidance of $285–305 million implies second-half 2026 revenue of $197–217 million, which would be growth of 128–152 percent year on year against second-half 2025 revenue of $86.238 million. That second-half requirement is unproven at the as-of date and depends on Astrobotic's contribution and on backlog conversion, neither of which is quantified in the score file's evidence. A score of 6 or higher on growth, the file notes, would require that second-half acceleration to be realised rather than guided.
Capital velocity, item A2, scores 3 out of 5, and the evidence for speed of access is concrete. Voyager raised net proceeds of approximately $402.3 million in its initial public offering on June 11, 2025, at $31.00 per share, then raised $402.5 million of zero-percent convertible notes due 2032 on September 28, 2026, with a conversion price of approximately $40.82 and including a $52.5 million greenshoe. Revolver commitments were raised to $250.0 million on July 6, 2026, including a $150.0 million accordion feature, and a shelf registration on Form S-3ASR was filed on August 14, 2026. Cash at June 30, 2026 was $373.436 million, and total liquidity was $585.5 million including $212.1 million of revolver availability. The cap on the score comes from price: the share price of $25.09 on October 23, 2026, on a press-reported basis, sat below the $31.00 offering price and 52 percent below the 52-week high of $52.40, so the 2032 converts were out of the money, with conversion 62.7 percent above the price at the as-of date, making them debt-like overhang rather than equity at that moment. Further dilution is also possible from Astrobotic contingent consideration running to March 31, 2028. Access to capital is demonstrably fast; each successive raise is getting more expensive in price terms.
Hiring and productivity, item A3, scores 2 out of 5. Voyager employed approximately 800 people across 14 locations at December 31, 2025, up from approximately 500 during 2025, but that increase came primarily through acquisitions rather than organic hiring velocity, so headcount growth is not clean evidence of blitz hiring. Revenue per employee was approximately $208,000 on a full-year 2025 derived basis, low for a technology company and consistent with hardware and mission services at subscale. Innovation spending, a company operating metric defined as Section 174 research spending plus development-program spending, was $53.805 million in the second quarter, or 102.0 percent of sales, and $107.163 million in the first half, or 121.8 percent of sales; excluding Starlab, second-quarter innovation spending was $29.039 million, or 55.1 percent of sales. Investment intensity above total revenue, with no productivity payoff yet visible in margin, is why this item scores low despite the scale of spending.
Order velocity, item A4, scores 4 out of 5 and is the strongest item in the speed section. Record bookings of $113.0 million, a book-to-bill ratio of 2.1 times, and a record backlog of $335.5 million, approximately 1.9 times trailing-twelve-month revenue, constitute the strongest single demand signal in the file. The score file records an expectation that 62.1 percent of the $189.0 million funded backlog converts within 2026. The cap at 4 rather than 5 reflects three limits: no quantified market share is disclosed, commercial revenue was only $3.601 million in the second quarter against $49.148 million from the United States Government, and funded backlog converts only as programs execute. This is order velocity within one dominant customer, not demonstrated share-taking across a market.
Moat: heritage and partners, but no flywheel yet
Moat scores 18 out of 60, the weakest positive section, and the gap between its items explains the company's overall grade more than any other section. Network effects, item B1, score 4 out of 18. Voyager is a business-to-business and government prime contractor and subcontractor, and no consumer or user-side network effect exists. What does exist is heritage and an ecosystem: more than 1,400 International Space Station missions managed or executed, a September 2025 station launch of what the company describes as the first known space cloud infrastructure, and the Starlab joint-venture ecosystem, with equity partners Airbus, Mitsubishi, MDA Space, Space Applications Services, and Palantir, plus strategic partners Hilton, Northrop Grumman, and Ohio State University, and a Palantir operating-system linkage in defense edge computing. The ecosystem is real, the score file stresses, but it is pre-revenue at the joint-venture level and creates no flywheel yet: there is no evidence that each new customer makes the product more valuable for the next. Four points credit heritage and the partner ecosystem; a true network score would require demonstrated cross-program compounding.
Distribution scalability, item B2, scores 5 out of 18. The channel is prime and subcontractor work for the United States government and commercial customers, and growth has come by acquisition plus organic program wins. The Astrobotic acquisition, closed July 10, 2026 for up to $300.0 million, illustrates the model: $96.1 million in cash plus 2,024,880 Class A shares at close for the base consideration plus assumed debt, with $69.5 million of contingent consideration deemed earned and the remainder running to March 31, 2028, and with the purchase-price allocation incomplete and the majority expected to be allocated to goodwill and intangibles. Distribution does not scale like software: backlog conversion is lumpy and, in the company's own management discussion, driven by the timing of large program wins; contracts are generally terminable for convenience; and each program is bespoke. The acquisition engine adds capability, but it does not add a repeatable, low-marginal-cost channel.
Market size, item B3, scores 7 out of 12, the highest moat item, and it rests on the G2 wedge rather than on a company figure. The company's 10-K states no single total addressable market figure for Voyager's slice, so the wedge is the scorer's definition, declared before scoring: first, United States and allied defense-space hardware and services in Voyager's own lines — solid propulsion and energetics, radiation-hardened laser and radio-frequency communications and signals intelligence, mission management and mission services; second, NASA and commercial low-Earth-orbit destination services, the market for replacing the International Space Station, which is scheduled for decommissioning in 2030; and third, government and commercial lunar logistics, meaning landers in the class of the Commercial Lunar Payload Services program, including Griffin. The whole defense budget, the whole space economy, launch vehicles broadly, and satellites broadly are all explicitly excluded. The arithmetic is that the bar is trailing-twelve-month revenue of $174.230 million times ten, or approximately $1,742 million of annual revenue — approximately $1,664 million on a full-year 2025 base, with the same conclusion either way — and the wedge needs only to sum to that figure within a pool the 10-K contextualises with a United States defense budget of approximately $839 billion for fiscal 2026, cited as context and not as a market size. A single-digit share of a defense-space plus low-Earth-orbit plus lunar wedge measured in the tens of billions per year is arithmetically reachable. The cap at 7 reflects that backlog of $335.5 million covers only approximately 19 percent of the bar, and that reaching the bar requires Starlab or Griffin, or both, to become multi-hundred-million revenue lines from zero today.
Gross margin, item B4, scores 2 out of 12, and the evidence is set out in the thesis section above. The drivers identified in management discussion are program cost growth and unfavourable estimate-at-completion adjustments — negative $4.220 million in the second quarter and negative $11.651 million in the first half, an earnings-per-share effect of negative $0.35 — on a contract mix that shifted sharply toward firm-fixed-price work, from 39.3 percent of revenue a year earlier to 59.3 percent of second-quarter revenue. The company is taking more fixed-price risk exactly as its cost estimates are deteriorating, and two points credit only the fact that second-quarter gross profit remained positive. Anything higher, the file notes, would require a margin floor that does not exist at the as-of date.
Creative destruction: a clear replacement thesis, unproven displacement
Creative destruction scores 7 out of 15. The order being replaced, item C1, scores 4 out of 5, the joint-highest item score in the whole assessment alongside order velocity. The thesis is clearly articulated in company framing: legacy defense primes and legacy space infrastructure give way to an agile, vertically integrated defense-technology and commercial space infrastructure company — propulsion and energetics, artificial-intelligence-enabled edge computing in contested environments, a commercial low-Earth-orbit destination replacing the International Space Station, and a commercial lunar logistics layer, Griffin, replacing purely government-run lunar access. NASA selected Voyager's team to develop an International Space Station replacement, and Starlab is positioned as that successor. Four rather than five because the order being replaced is identified and the company sits inside the official replacement process, but replacement has not occurred.
Irreversible behaviour change, item C2, scores 2 out of 5. The evidence is milestones and orders, not yet displaced behaviour. Griffin-1 completed acceptance testing on October 13, 2026 — thermal-vacuum, vibration, acoustic, and electromagnetic testing, including approximately two weeks in the Jet Propulsion Laboratory's 25-Foot Space Simulator — toward a launch planned for late 2026 to the lunar South Pole, with a manifest of 10 payloads from 6 countries including NASA and the European Space Agency. But the lander has not launched or landed, and acceptance testing verifies ground-test performance only. Starlab completed its Phase I preliminary design review in January 2025, with a critical design review next, then production, then a launch anticipated in 2029 under a SpaceX Starship contract, and with $34.3 million of NASA grant proceeds remaining at December 31, 2025 — grants, the file stresses explicitly, are not revenue. Golden Dome awards of $84.3 million and record bookings show customers shifting orders, but contracts are terminable for convenience and no incumbent share loss is quantified. Two points reflect genuine pre-commercial milestones without irreversible adoption.
Cost-structure change, item C3, scores 1 out of 5, the lowest positive item in the assessment. No cost-structure disruption is demonstrated at the as-of date: there is no disclosed unit-cost collapse, no evidence that Voyager delivers a mission, a propulsion unit, or a lunar payload at a structurally lower cost than incumbents, and the observable cost direction is adverse, with the fixed-price mix rising, estimate-at-completion adjustments unfavourable, and innovation spending at 102.0 percent of second-quarter sales. The description of the company as agile and vertically integrated is a model description, not a measured cost advantage. One point credits only the integration thesis — acquired capabilities under one prime — as a candidate mechanism for a future cost advantage.
Deductions and risks: twenty points, and structural rather than temporary
Deductions total minus 20, and the score file is explicit that this is not a collection of one-off items but a structural picture. Debt, item D1, scores minus 8 out of a possible minus 10. Total liabilities were $632.691 million at June 30, 2026 — convertible notes net of $448.903 million plus operating leases of $42.162 million plus contract liabilities of $30.426 million — against total equity of $376.582 million. After the quarter, the September 28, 2026 issue of $402.5 million of 2032 converts lifts pro-forma convertible principal to approximately $851 million, although the file notes that precise pro-forma cash cannot be stated because third-quarter burn was undisclosed at the as-of date. Burn is severe and accelerating: first-half operating cash flow was negative $84.027 million against negative $30.903 million in the first half of 2025; capital expenditure was $86.652 million less grants of $31.056 million; free cash flow for the first half was negative $139.623 million on the company's definition, net of grant funding, with the second quarter alone at negative $72.829 million. Two mitigants keep the deduction from the maximum: the new converts carry a zero-percent coupon with a 2032 maturity, so no near-term maturity wall is disclosed, and the September raise replenished cash after the June balance. At first-half burn rates, however, the replenishment provides time rather than sustainability. Share-based compensation is modest at $3.762 million in the second quarter, so dilution here comes from debt and acquisition equity rather than from share-based pay.
Revenue quality, item D2, scores minus 4 out of minus 10. The file is careful to say what this deduction is not: no restatement, auditor change, or audit-opinion issue is identified in the pack, so this is not an accounting-integrity deduction. It is an earnings-quality deduction, built from losses at every level — first-half gross margin of 3.3 percent, an operating loss of negative $96.055 million, and a net loss of negative $94.690 million — plus unfavourable estimate-at-completion adjustments of negative $11.651 million in the first half, showing fixed-price execution risk rather than pure investment, plus government grants of $31.056 million in first-half capital-expenditure grants and $6.9 million earned but unbilled at June 30, 2026, which flatter free-cash-flow optics, plus a guidance raise issued in the same quarter that gross margin collapsed. The second-half growth implication of that guidance is, in the file's words, the single largest credibility item for the next rescore.
Governance, item D3, scores minus 4 out of minus 5. Voyager is a disclosed controlled company. Chief executive Dylan Taylor, who is also chairman and has been chief executive since August 2019, beneficially owns all outstanding Class B shares, which carry 15 votes each; at July 31, 2026 counts, Class B controlled approximately 61.0 percent of total voting power, or 86.378 million of 141.649 million votes, on approximately 9.4 percent of shares outstanding. The company states the consequence: under the New York Stock Exchange controlled-company exception, it may elect not to comply with certain governance standards, such as a majority-independent board. The board has 7 members and is classified. Minus 4 rather than minus 5 because the structure is disclosed and no insider-selling or self-dealing evidence is in the pack — but minority shareholders cannot outvote the chief executive on any matter, which the file describes as close to the maximum structural discount the model allows short of a realised governance event.
Regulatory and social cost, item D4, scores minus 4 out of minus 5. Single-customer dependence is the dominant risk: United States Government revenue was 93.2 percent in the second quarter, 89.6 percent in the first half, and 86.1 percent in full-year 2025, and 87.7 percent of funded backlog, approximately $165.8 million of $189.0 million, relates to the United States government, counting all government entities as one customer. Contracts are generally terminable for convenience. The 10-K and 10-Q risk factors flag federal spending reductions and budget delays, fixed-price contract losses, Starlab execution risk, the unpredictable environment of space, customer concentration, acquisition integration, limited operating history, and export-control and licensing constraints. Program risk compounds the concentration: Griffin is unlaunched with a high-risk lunar landing ahead, Starlab Phase II funding is competitive and not secured, and International Space Station decommissioning in 2030 is a deadline rather than a guarantee of Starlab selection. Minus 4 rather than minus 5 because no realised sanction, lawsuit, or funding cut is in the pack — the risk is structural and prospective.
Taken together, the score file's own summary of the deduction side is worth preserving: governance concentration and single-customer concentration together account for 8 of the 20 deduction points, and with debt at minus 8, the FLAG is driven by structure — one customer, one voting controller, and a balance sheet carrying heavy convertibles — rather than by a single bad quarter. The valuation note, which does not enter the score, adds context: market capitalisation of approximately $1.53 billion on a press-reported basis, from the October 23, 2026 close of $25.09 multiplied by 61.03 million shares, implies a trailing price-to-sales ratio of approximately 8.8 times on a computed basis, within a 52-week range of $17.41 to $52.40, and that capitalisation sits at approximately 88–92 percent of the G2 bar of approximately $1.74 billion, so there is no low-valuation cushion relative to the bar. The business score does not look at price; the note is context only.
What to watch: the tiebreakers the score file names
The score file names its own tiebreakers, and they are best reported as open items rather than as expectations. First, third-quarter 2026 results are due after the market close on Monday, November 2, 2026, with an earnings call on Tuesday, November 3, 2026, at 9:00 a.m. Eastern Time, on a company-confirmed schedule announced October 1, 2026. Those results are post-as-of-date and are excluded from this score. The file identifies the third quarter as the tiebreaker for the narrow G1 pass: whether the second-half run-rate measures against the guidance-implied $187–217 million, and whether guidance is maintained, are the questions the next rescore must answer from the reported figures. Second, the Griffin launch planned for late 2026, and its landing outcome, will test the lunar leg of the G2 wedge, which today rests on an acceptance-tested but unlaunched vehicle. Third, the Starlab Phase II funding decision will test the low-Earth-orbit leg, which today rests on a completed preliminary design review, a 2029 launch anticipation, and competitive funding that is not secured. Fourth, backlog conversion and the fixed-price cost trend will test whether record orders convert into revenue at margins that stop deteriorating: funded backlog of $189.0 million, the estimate-at-completion trend, and the firm-fixed-price share of revenue are the series to follow in the filings. Fifth, the structural variables do not change quarter to quarter and should be tracked as such: the government share of revenue and funded backlog, the voting concentration, and the convertible principal balance after the September issue.
Voyager's 18 is therefore a legible score rather than a puzzling one. A company can post record orders, raise capital quickly, assemble a partner ecosystem that includes major aerospace and technology names, and sit inside an official program to replace the space station — and still score 18, because the model gives its largest weight to moat, where Voyager has heritage but no flywheel, and deducts heavily for a balance sheet, a cost trend, a governance structure, and a customer concentration that are all structural. The two pre-revenue programs, Griffin and Starlab, carry the entire path to the market ceiling, and the score's narrow gate passes say only that the path is arithmetically possible, not that it is secured. What the next filings show about conversion, margin, and funding will determine whether this assessment reads, in retrospect, as an early snapshot of a company still in the first act of its blitz, or as an accurate portrait of demand that never became economics.
For education and research purposes only. Figures are from public filings and reporting available before October 24, 2026, as recorded in the Voyager Technologies 2026Q4 score file.
More Frontier companies
Other Frontier names on the Blitz Index, highest score first: Rocket Lab (62/B), Tesla (62/B), Illumina, Inc. (61/B).
Next earnings
Q4 2026 · Expected
Coverage
Voyager Technologies, Inc. · Q3 2026 reported Nov 2, 2026 (AMC) · Score 19 · Grade D · ⚠️ BlitzFailing watch
Embed this score
Copy the HTML below to show this score on your site. The badge links back to this page and updates automatically when the score changes.
Preview:
BlitzLab scores businesses against a scholar’s standard — not investment advice. No price targets, no buy/sell recommendations. Figures are from SEC filings (XBRL) as labeled in the source scorecard.