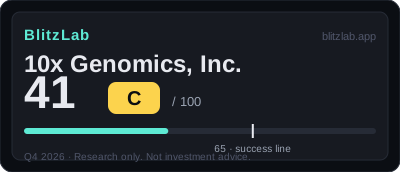
10x Genomics, Inc. — Blitz Index 41 (C)
10x Genomics scores 41 — three flat years, a patent-settlement cash pile, and a second act (Atera) still booked, not billed.
Last re-scored: November 5, 2026.
Confidence: High · Category: frontier
Score breakdown
| Section | Score | Detail |
|---|---|---|
| A · Speed | 11 / 25 | Three flat years: FY2023 $618.7M → FY2024 $610.8M → FY2025 $642.8M (+5.3% only on $46.1M settlement licences; core −2.3%). H1 2026 core +5.7% is the first reversal signal |
| B · Moat | 32 / 60 | 8,046 installed instruments + 79% consumables repeat revenue + a patent portfolio defended in court; 69.1% FY2025 gross margin — but no true user-to-user network effect |
| C · Creative destruction | 9 / 15 | Single-cell plus spatial resolution replacing bulk tissue analysis without location context — the category creator, in a platform-vs-platform fight (Bruker, Vizgen, Akoya, Illumina) |
| D · BlitzFailing | −11 | Settlement optics (licences $46.1M, gains $49.9M flatter headline growth and profit) + Class B ~45.6% of votes + SBC 16.9% of revenue + open Illumina/Element suits |
Think we scored it wrong? Score it yourself →
Radar axes (0–100): Moat 53 · Speed 44 · Creative 60.
Watch item
Gates: G1 ✓ (confirmed PMF, second curve press-reported) · G2 ✓ (estimate — broad TAM only; bar ≈ $6.17B). 25 points below the threshold — first score.
Strengths
- Spatial consumables +19% (FY2025) → +23.0% (H1 2026) — the workflow shift is real
- 8,046 cumulative instruments with consumables at 79% of FY2025 revenue
- Cash plus securities $552.0M, no borrowings, H1 2026 FCF ~$39.9M
- Atera: 40+ booked orders ahead of revenue recognition
- Gross margin 69.1% (FY2025) → 74% in Q2 2026
Concerns
- TTM revenue $616.9M equals FY2023 — three years without growth
- FY2025 growth (+5.3%) is entirely settlement licences ($46.1M); core revenue fell 2.3%
- Instrument revenue −39% (FY2025) and −47% (Q2 2026) — Atera wait-and-see demand
- Class B holds ~45.6% of votes on ~7.7% of shares
- U.S. −21% and China −35% in Q2 2026; open suits against Illumina and Element remain
Research notes
Thesis: the first act is over, the second is still an order book
10x Genomics, Inc. (NASDAQ: TXG) scores 41 out of 100, grade C, under the BlitzLab v1.0 model frozen on 2026-10-10. The arithmetic is 11 for Speed, 32 for Moat, 9 for Creative Destruction, and minus 11 in deductions: 11 + 32 + 9 − 11 = 41. That leaves the company 24 points below the 65-point line, and there is no FLAG attached, because deductions of 11 sit below the 15-point FLAG bar. This is the company's first scoring in the BlitzLab record, scored on 2026-10-25, and it is classified as GROWTH, on trailing-twelve-month revenue of $616.9 million, below $1 billion.
The single sentence that best captures this company is the one the score file itself uses as its framing: it is a valley company. The first act is finished and the second act has not yet produced revenue. The first act was Chromium and the standardisation of single-cell analysis. The installed base, the consumables engine, and the patent portfolio are the inheritance of that act. The second act is Atera, a spatial platform launched in April 2026, shipping since September 2026, with more than 40 booked orders on a reported basis and more than 100 customer projects reserved through the Catalyst service model, also on a reported basis. No Atera revenue was separately disclosed as of the scoring date. The gate verdict is a pass on both gates, but the pass is carefully qualified, and the qualifications matter more than the pass itself.
Gate G1, product-market fit or a second growth curve, passes on a split basis. Fit itself is confirmed: a cumulative installed base of 8,046 instruments as of 2025-12-31, confirmed in SEC filings, and consumables worth $507.2 million making up 79 percent of fiscal 2025 revenue, rising to 87 percent of core product and service revenue in the first half of 2026. That is a razor-and-blade repeat-revenue engine that is still running. But the growth leg of the gate is close to a failure: trailing-twelve-month revenue of $616.9 million is effectively identical to fiscal 2023 revenue of $618.7 million, three years of zero growth, and core product and service revenue fell 2.3 percent in fiscal 2025. The pass rests on the second-curve leg instead: Spatial consumables grew 19 percent in fiscal 2025 and 23.0 percent in the first half of 2026, and Atera moved from launch to shipping to booked orders. The score file is explicit that this is a pass at the order stage, not a pass at the revenue-proof stage, and that the first revenue verification arrives after the scoring date, with third-quarter 2026 results.
Gate G2, a ten-year market ceiling at least ten times current revenue, also passes, on estimated and reported grounds. Ten times trailing revenue of $616.9 million gives a bar of approximately $6.17 billion. The broad single-cell analysis market, estimated at $4.82 billion in 2025 and $23.18 billion in 2035 at a 17.4 percent compound annual growth rate on Emergen Research reporting, clears that bar by roughly 3.8 times. The narrower single-cell spatial multiomics market, estimated at $1.8 billion in 2025 and $7.2 billion in 2034 on Dataintelo reporting, also clears the bar but thinly, by roughly 1.2 times. The pass therefore rests on the broad market plus diagnostic expansion, including the Cleveland Clinic and Lausanne collaborations and the STELA effort, all of which are at a stage with no confirmed revenue. On research tools alone, the score file states plainly, the pass would be tight. No recurring revenue backlog or order backlog figure is disclosed, and the file does not use one as evidence.
Founded in 2012 and listed in September 2019, 10x Genomics built the category it now defends. The question the score answers is whether a category creator with a flat top line, a strong margin structure, and a new platform still in its order phase can blitz again, or whether it has become a different kind of company: a high-margin, mature research-tools business with a promising but unproven second platform. The score of 41 says the evidence, as of 2026-10-25, supports the second description more than the first, while leaving the door open for the second act to change the answer.
What the company makes, and why the platform generations matter
The company's instruments let researchers analyse biology at single-cell resolution and, increasingly, with spatial context: not just what a tissue contains, but where each signal sits within it. The platform generations trace a steady removal of trade-offs. Chromium established single-cell analysis. Visium and Xenium added spatial analysis, and Atera is presented as the integration step, combining whole-transcriptome scale, single-cell sensitivity, and scale in situ, so that an experiment no longer has to sacrifice one of those dimensions for another. That lineage is the company's blitzscaling story in miniature: each generation widened what an experiment could do, and each widening was supposed to widen the market.
The commercial shape of the business follows the instruments. Customers acquire an instrument and then consume reagents and consumables to run experiments on it, which is why the installed base and the consumables share are the two numbers that anchor almost every other judgement in the score. A cumulative 8,046 instruments were installed as of the end of 2025, and consumables supplied 79 percent of fiscal 2025 revenue. When customers acquire instruments, future consumables revenue is seeded; when instrument revenue collapses, as it did in fiscal 2025 and again in the second quarter of 2026, the question is whether the seeding has stopped or merely paused while customers wait for the next generation. The score file treats that question as unresolved, and the whole profile that follows is an attempt to keep it unresolved rather than to answer it by assumption.
Speed: 11 out of 25 — a company that slowed down on purpose, and is now trying to turn
Speed is the weakest of the three positive axes in absolute terms, at 11 out of 25, or 44.0 on the 100-point radar conversion. The four items inside it tell a story of deliberate deceleration followed by a faint, single-half-year turn.
Growth, A1, scores 2 out of 10. The revenue path is fiscal 2023 at $618.7 million, fiscal 2024 at $610.8 million, down 1.3 percent, and fiscal 2025 at $642.8 million, up 5.3 percent. The fiscal 2025 increase, however, came entirely from patent-settlement licensing revenue of $46.1 million, against $0.3 million a year earlier, while core product and service revenue was $596.7 million, down 2.3 percent. Trailing-twelve-month revenue of $616.9 million was down 4.3 percent year on year. The turn signals are real but narrow: core revenue grew 5.7 percent in the first half of 2026, with 2.7 percent growth in the second quarter, and fiscal 2026 guidance of $610 million to $630 million is framed by the company as 2 to 5 percent growth over fiscal 2025 excluding settlement items. The score file's reasoning is balanced on that edge: the negative trailing growth blocks a higher mark, while the first-half turn blocks a zero. A score of 2 is, in effect, a refusal to call either the decline or the recovery the whole story.
Capital velocity, A2, scores 4 out of 5, the strongest item in Speed. Cash of $502.5 million plus marketable securities of $49.5 million totalled $552.0 million as of 2026-06-30, with no borrowings; total liabilities of $204.5 million consist of leases, deferred revenue, and contingent consideration rather than debt. Operating cash flow in fiscal 2025 was $136.1 million, against $6.7 million in fiscal 2024, implying free cash flow of approximately $130.1 million on the score file's calculation, with approximately $39.9 million of free cash flow calculated for the first half of 2026. On those figures the company can fund an Atera expansion from its own resources without raising new equity. The point withheld is about the quality of the cash-flow turn: the operating cash flow reversal includes settlement cash, a $68 million Bruker payment split and a $26 million Vizgen upfront amount, so it cannot be read as a pure operating reversal, and operating expenditure could re-accelerate as Atera scales and the diagnostic push advances. Capital here is a buffer, not blitz fuel, and the score reflects that distinction.
Hiring and productivity, A3, scores 2 out of 5. Headcount was 1,178 as of 2025-12-31, split into research and development at 332, sales, marketing and support at 473, general and administrative at 185, and manufacturing at 188. Revenue per employee was approximately $0.55 million on fiscal 2025 revenue and approximately $0.52 million on a trailing basis, falling rather than rising. Research and development spending of $238.6 million, or 37.1 percent of revenue, and SG&A spending of $316.1 million, or 49.2 percent of revenue, both declined against fiscal 2023. This is not a hiring blitz; it is a cost-reduction story, and the score file says so directly. Added to that is a recurring cost of forecasting error: inventory excess and obsolescence write-downs of $26.5 million in fiscal 2025 and $11.3 million in fiscal 2024, a repeated charge for demand that did not arrive as predicted.
Share velocity, A4, scores 3 out of 5, and it contains the profile's most instructive contradiction. Cumulative installations rose by 1,007 units in 2025: Chromium up 669, Visium up 205, and Xenium up 133, with Xenium's installed count growing 32 percent, the fastest of the three. Yet instrument revenue fell 39 percent in fiscal 2025 and 47 percent in the second quarter of 2026. Unit growth and revenue decline moved in opposite directions, which the score file attributes to price reductions combined with customers deferring purchases while awaiting Atera. Consumables pull-through, by contrast, held firm, at 79 percent of fiscal 2025 revenue and 87 percent of core revenue in the first half of 2026. Atera's more than 40 booked orders are a leading indicator of share velocity, but because no Atera revenue has been demonstrated, they support a middle mark rather than a high one.
Moat: 31 out of 60 — patents and an installed base, not a network
Moat is the largest section of the model at 60 points, and 10x Genomics takes 31 of them, or 51.7 on the radar conversion. The shape of the moat matters more than its size: it is built from patents and workflow embedding, not from users making the product more valuable for one another.
Network effects, B1, score 7 out of 18. The score file agrees with its underlying fact pack that there is no genuine user-to-user network effect here. What exists instead is a set of adjacent strengths: an 8,046-instrument installed base embedded in laboratory workflows, a patent portfolio whose value has been demonstrated through litigation victories and settlements, and data gravity through STELA with Bioptimus in the first quarter of 2026 and multi-year collaborations with Cleveland Clinic and Lausanne in the second quarter of 2026. The discount is equally clear. Customers can switch, because competing platforms exist, and the patent structure blocks through litigation rather than locking out through incompatibility. Data-business revenue is undisclosed, so no credit is given for a data monetisation engine that has not yet shown itself in the accounts. Seven points is a mark for a defensible position that is not a network.
Distribution scalability, B2, scores 8 out of 18. The direct channel reaches academic and pharmaceutical laboratories worldwide, and the distribution structure itself scales: Chromium and Visium CytAssist can be installed by users themselves, Xenium requires installation and training, and the Catalyst service model lowers the adoption barrier for Atera by letting customers run projects without first acquiring the instrument. The discount comes from the map rather than the mechanism. In the second quarter of 2026, the Europe, Middle East and Africa region grew 15 percent year on year, while the United States fell 21 percent and China fell 35 percent on the score file's calculation, with China down 23 percent for the first half on the same basis. Academic funding and geopolitics are a live drag on a channel that is, in the score file's phrase, standing its ground rather than expanding. Eight points describe distribution that works but is not currently carrying the company forward.
Market size, B3, scores 7 out of 12. The gate analysis already showed the structure: a broad market large enough to clear the bar comfortably, and a narrow market that clears it only thinly. The score adds a further squeeze. The bar of approximately $6.17 billion amounts to roughly 128 percent of the broad market's 2025 estimated size of $4.82 billion, so reaching the bar means growing with, and taking share in, a market that must itself expand severalfold, and the narrower spatial multiomics market reaching $7.2 billion by 2034 leaves little slack. For 10x Genomics to fill the bar, the score file argues, it must move beyond research tools into diagnostics, where revenue is still unconfirmed, and it must do so while spatial biology remains a platform-versus-platform contest rather than a settled hierarchy. The market is large; the company's demonstrated claim on it is not yet proportionate, and 7 points keep both halves of that sentence together.
Gross margin, B4, scores 10 out of 12, the highest single item in the profile. Gross margin was 69.1 percent in fiscal 2025, on $443.9 million of gross profit, improving from 67.9 percent in fiscal 2024 and 66.2 percent in fiscal 2023, and it continued upward into 2026, at 70 percent in the first quarter and 74 percent in the second quarter, the latter including a $2.6 million tariff refund and lower amortisation, with 72.4 percent for the first half as a whole. For a company that makes hardware and consumables, that is a high absolute margin with an improving trend, and it is the clearest evidence that the underlying product economics are healthy even while the top line is flat. The score file is careful to place the loss-making elsewhere: the operating loss of minus $61.0 million, or minus 9.5 percent, includes a $49.9 million settlement gain, and excluding that gain the operating loss would be approximately minus $110.9 million on the file's calculation, with a net loss of minus $43.5 million. Those are treated as a profitability-structure problem under deductions, not as a reason to mark down the margin itself.
Creative destruction: 9 out of 15 — a real replacement, an incomplete behaviour change
Creative destruction is the company's best radar axis at 60.0, on 9 out of 15 points, and it is also the axis where the gap between what the technology replaces and what customers have actually done is most visible.
The order being replaced, C1, scores 4 out of 5. The target is precise: bulk tissue analysis without location information, and single- or low-plex histology, approaches that can say what a sample contains but not where each signal sits. Against that, the company offers single-cell resolution plus spatial context at transcriptome scale, moving from Chromium through Visium and Xenium to Atera, each step removing a trade-off in scale, sensitivity, or gene selection. The company created this category, which is why the mark is high. The withheld point is about contest: Bruker, formerly NanoString, Vizgen, Akoya, Illumina, and BGI with STOmics are all competing platform against platform, so this is not a one-sided replacement but an ongoing fight over which platform defines the category.
Irreversible behaviour change, C2, scores 3 out of 5. The change is visible in the product mix: Spatial consumables grew 19 percent in fiscal 2025 and 23.0 percent in the first half of 2026, while Single Cell consumables were flat to declining, down 2 percent in fiscal 2025. Researchers are measurably shifting work toward spatial workflows. But total revenue has been flat for three years, instrument purchasing was deferred ahead of Atera's launch, a reversible wait rather than an irreversible switch, with instrument revenue down 47 percent in the second quarter of 2026, and diagnostics remain at a stage with no revenue. Three points credit a real migration inside a flat total, without pretending the migration has yet remade the company.
Cost-structure change, C3, scores 2 out of 5, the weakest item in this section. Atera does integrate whole-transcriptome scale, single-cell sensitivity, and scale in situ, removing the per-experiment trade-off, but the score file finds no demonstrated cost collapse. The reported Atera list price of $495,000, on a reported basis from a secondary source, is a premium price in an academic market where capital budgets are constrained, which is an entry premium rather than a cost reduction. No measured per-unit cost figure is disclosed, and the consumables model, for all its repeat-revenue strength, is a razor-and-blade model rather than a collapse in the customer's cost structure. Two points acknowledge the technical integration while reserving credit for an economic transformation that has not been shown.
Deductions and risks: minus 11 — no FLAG, but a heavy combination
Deductions total minus 11, below the minus 15 FLAG line, so no FLAG is attached. The score file nonetheless warns that the combination weighs more than any single item, and the four items repay separate attention.
Debt, D1, is minus 2 out of a possible minus 10. Leverage itself is not a concern: there are no borrowings, and cash plus securities of $552.0 million stand against total liabilities of $204.5 million. The deduction comes entirely from stock-based compensation, at $108.8 million in fiscal 2025, or 16.9 percent of revenue on the file's calculation, down from $140.7 million in fiscal 2024 and $167.0 million in fiscal 2023. The trend is improving and the level remains the company's largest single dilution cost, and the file flags a small definitional difference with an XBRL tag figure of $109.1 million. Zero debt plus a persistent dilution burden nets to minus 2.
Revenue quality, D2, is minus 4, the largest single deduction. The structure is disclosed rather than hidden, and the file stresses that this is not an accounting irregularity: settlement items made the headlines look better than the core business. Fiscal 2025 revenue growth of 5.3 percent depended on licensing revenue of $46.1 million while the core fell 2.3 percent; the fiscal 2025 operating loss includes a $49.9 million settlement gain; the second quarter of 2025 showed an operating profit of positive $30.1 million that becomes a loss once a $40.7 million settlement gain is removed; and operating cash flow of $136.1 million includes the $68 million Bruker and $26 million Vizgen settlement cash. Recovering the value of a patent portfolio in cash is a genuine achievement, and the file treats it as one. The deduction exists because a reader who takes the growth, the cash-flow reversal, or the quarterly profit at face value would misjudge the business. Minus 4 is the price of that optical illusion.
Governance, D3, is minus 3 out of a possible minus 5. The dual-class structure is confirmed: Class B shares carry 10 votes each, and Class B represents approximately 7.7 percent of equity but approximately 45.6 percent of voting power, calculated as 100.8 million votes out of 221.0 million. Founder control is therefore structurally entrenched. The chief executive is co-founder Serge Saxonov, and the file records no chief-executive-change flag and no evidence of abuse. The deduction is for the structure itself, which the file rates as a stronger confirmed concentration than the comparable case it cites, and insider signals were outside the fact pack's scope, unreviewed, and not reflected in the mark.
Regulatory and social cost, D4, is minus 2 out of a possible minus 5. Closed litigation actually ended favourably: the NanoString matter, now Bruker, settled for $68 million in May 2025, Vizgen settled for $26 million in February 2025, and Takara settled in May 2026, along with a Curio settlement. Open items remain: litigation against Illumina and Element Bioscience is in progress on a reported basis, dependence on academic and government research funding is a standing demand risk named in the 10-K risk factors, tariffs cut both ways in the profit-and-loss account, with a $2.6 million tariff refund in the second quarter of 2026, and China fell 23 percent in the first half. Past litigation wins offset part of the litigation risk, but funding and China exposure are current, not historical, and minus 2 reflects that balance.
Two further risk items sit outside the four deduction lines but belong in any honest account. The Scale matter carries a possible additional $30.0 million of contingent consideration, and the Proteintech acquisition, completed on 2026-06-08, brings an integration task whose outcome is not yet visible in the numbers. Neither changes the total, but both belong on the watch list, because a company in a valley has less room to absorb an integration problem than a company in full flight.
Blitzscaling fit: a platform lever waiting for its second generation
In blitzscaling terms, the company's main lever is the platform itself: the generational replacement of the technology stack. Chromium, then Visium and Xenium, then Atera, each generation removing the previous generation's trade-off and widening the market in the process. The secondary lever is data, through STELA and the Cleveland Clinic and Lausanne collaborations, where accumulating data could strengthen the platform over the medium term, but where revenue is still absent, so it remains a secondary lever. The weak levers are network effects, which do not exist in user-to-user form, distribution, which is in a defensive phase rather than an expansion phase, and capital, which is currently a buffer rather than fuel.
The speed-versus-efficiency trade was made, and made in the efficiency direction. From fiscal 2023 to fiscal 2025 the company cut research and development and SG&A spending and shrank its net loss from minus $255.1 million to minus $43.5 million. That is the opposite direction from a blitz: speed was traded for survival, and the price of that trade was three years of zero growth. The patent strategy ran in parallel, converting litigation against competitors into royalties and cash rather than simply driving competitors from the market, which treats the patent portfolio as a monetisable asset rather than purely as a wall. The cost of that strategy is that settlement cash is closer to one-off than to recurring revenue, and it must not be mistaken for operating momentum.
The stage judgement follows from those two moves. The first blitz act, Chromium's standardisation of single-cell analysis, is over. The second act, Atera's standardisation of spatial analysis, is at the order stage. The first-half 2026 core growth of 5.7 percent is the first sprout of the second act, but at the scale of trailing revenue it is still a sprout. The score file's verdict is that the company is not a FLAG case, since deductions sit at 11 against a 15-point line, but that the monitoring intensity should be high, because the combination of revenue-quality optics, concentrated voting control, and live funding, China, and open-litigation risks is heavier in sum than any one item alone.
The single largest blitzscaling risk, as the score file frames it, is stark: if Atera does not convert into revenue, what remains is a flat consumables business. Blitzscaling's premise is that speed creates the moat, and this company's speed has been stopped for three years. If the more than 40 booked Atera orders do not become revenue in the fourth quarter of 2026 and into 2027, Spatial consumables growth of 23 percent alone will not break the trailing revenue plateau of $616.9 million, and the company would have to be reclassified from a blitz company to a high-margin mature research-tools company. That reclassification is not a prediction; it is the fork in the road that the next set of results will help to illuminate.
What to watch: the verification calendar
The first verification date is a future marker only. Third-quarter 2026 results are scheduled for 2026-11-05, after the scoring date of 2026-10-25, and are therefore excluded from this score. When those results arrive, the items to check are the ones this profile has kept open: whether Atera booked orders begin to appear as revenue, and whether any Atera revenue is separately disclosed at all; whether Spatial consumables continue the 19 percent to 23.0 percent trajectory or revert; whether core product and service revenue extends the first-half 5.7 percent turn or gives it back; and whether instrument revenue recovers from the second-quarter decline of 47 percent or stays depressed, which would change the reading of the decline from a pre-launch wait to a demand question. No outcome is anticipated here, and none of these markers is a forecast.
Beyond that date, the watch list extends to the regional drag, with the United States down 21 percent and China down 35 percent in the second quarter of 2026 on the file's calculations, and to the funding environment for academic and government research that the 10-K names as a risk factor. The open litigation against Illumina and Element Bioscience, the possible additional $30.0 million Scale contingent consideration, and the Proteintech integration all belong on the same list, as does the diagnostic expansion, where the Cleveland Clinic and Lausanne collaborations and STELA must eventually show revenue if the broad-market gate argument is to become a commercial argument rather than a market-size argument.
The score file also records three open methodology questions for the v1.1 track, with the model itself unchanged. The first is how to treat a transition valley in growth scoring when a new product launch depresses existing product revenue through wait-and-see demand, as instrument revenue fell 39 percent in fiscal 2025 and 47 percent in the second quarter of 2026, since the current model does not distinguish waiting demand from disappearing demand. The second is whether to formalise finer deduction bands for settlement items that distort revenue, operating cash flow, and operating profit simultaneously, as the fiscal 2025 licensing revenue of $46.1 million and settlement gain of $49.9 million did, since the current model has no explicit band between disclosed non-recurring items and quality distortion. The third is whether to add quantitative anchors for installed-base lock-in, such as the 8,046 instruments and the 79 percent consumables share, to the network and distribution items, since companies without network effects currently tend to score uniformly low regardless of how strong their hardware-and-consumables lock-in is. These are recorded as open questions, not as adjustments to this score.
For education and research purposes only. The figures above are drawn from the score file for the period ending at the scoring date of 2026-10-25, with reported, estimated, and calculated labels preserved where the file carries them. The market-size estimates, the Atera order counts, the Atera list price, and the open-litigation items are reported rather than confirmed in filings, and the market-capitalisation anchors in the score file's valuation note conflict with each other, at approximately $9.96 billion on one reported basis against approximately $9.3 billion on a share-count calculation at the 2026-10-23 close of $71.55, so neither is relied on here. The reported price history in that note, from a close-based high of $202.37 on 2021-04-26 to a low of $6.78 on 2025-04-07 and $71.55 on 2026-10-23, is context only and plays no part in the score, and no analyst price views are included because the fact pack contains none.
More Frontier companies
Other Frontier names on the Blitz Index, highest score first: Rocket Lab (62/B), Tesla (62/B), Illumina, Inc. (61/B).
Next earnings
Q4 2026 · Expected
Coverage
10x Genomics, Inc. · Q3 2026 due Nov 5, 2026 (AMC, confirmed) · Score 41 · Grade C
Embed this score
Copy the HTML below to show this score on your site. The badge links back to this page and updates automatically when the score changes.
Preview:
BlitzLab scores businesses against a scholar’s standard — not investment advice. No price targets, no buy/sell recommendations. Figures are from SEC filings (XBRL) as labeled in the source scorecard.