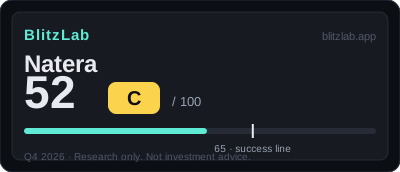
Natera — Blitz Index 52 (C)
A margin-proven diagnostics blitz carrying a $292.5M courtroom verdict — and a market price at twice its own bar.
Last re-scored: November 5, 2026.
Confidence: High · Category: frontier
Score breakdown
| Section | Score | Detail |
|---|---|---|
| A · Speed | 17 / 25 | Growth +35.9% → +37.7% on a $2.3B base; clinical MRD volume +56% YoY |
| B · Moat | 33 / 60 | Coverage decisions and guideline entrenchment keep widening, but distribution rides on payer decisions |
| C · Creative destruction | 12 / 15 | Blood-based cancer monitoring replacing tissue-and-wait; Medicare coverage keeps compounding |
| D · BlitzFailing | −10 | Guardant's $292.5M verdict upheld, plus Ravgen's $57M; SBC at 15.4% of revenue |
Think we scored it wrong? Score it yourself →
Radar axes (0–100): Moat 55 · Speed 68 · Creative 80.
Watch item
Gates: G1 ✓ · G2 ✓ (borderline). Bar ≈ $28.8B (FY2026E revenue × 10); market cap at ~2.0× the bar is a valuation note, kept out of the gate (BE precedent).
Strengths
- Revenue +35.9% (FY2025) → +37.7% (Q2 2026) — high-30s growth held on a $2.3B base
- Clinical MRD +56% YoY with a record +34,000 quarterly accession — the second curve accelerating
- Gross margin 64.7% with positive operating cash flow ($215.3M) and FCF — the margin ramp completed
- FY2026 guidance raised ($2.85–2.91B) and two Japan PMDA approvals extend the map
Concerns
- Guardant $292.5M (upheld, on appeal) plus Ravgen $57M — a final loss takes ~32% of cash
- Operating loss of $309.9M (FY2025): R&D +54% and SG&A +40% erase the margin ramp below the line
- SBC of $354.4M (15.4% of revenue) dilutes with no buyback offset
- Market cap of ~$56.7B (P/S ~20–25×) is a price the 52-point business score does not support
Research notes
Thesis: the margin is proven, the profit is not, and a courtroom verdict sits between the two
Natera, Inc. is a cell-free DNA diagnostics company founded in 2004 as Gene Security Network and listed in July 2015. Its business runs on three axes that share one laboratory platform: oncology, through the Signatera minimal residual disease test; women's health, through the Panorama noninvasive prenatal test and the Horizon carrier screen; and organ health, through the Prospera transplant monitoring test. The score file, dated to T = 2026-10-20, describes this as a platform-plus-evidence blitz: one cell-free DNA platform extended across three markets, with more than 350 peer-reviewed papers, confirmed in the DEF 14A, doing the work that advertising does in a consumer business — opening payer coverage, which in diagnostics is distribution itself.
The headline result is 52 out of 100, grade C, thirteen points below the BlitzLab 65 threshold. The composition of that number matters more than the number alone. Before deductions, the business scores 62: speed 17 of 25, moat 33 of 60, creative destruction 12 of 15. Deductions of 10 points then bring it to 52. That deduction total sits below the 15-point monitoring threshold, so no FLAG applies, but half of the entire deduction comes from a single item: regulatory and social cost, scored at the maximum of negative 5, driven by jury verdicts totalling $349.5 million. The score file's own summary phrase captures the tension exactly: the margin is proven, the profit is not. Gross margin rose from 45.5 percent to 64.7 percent over three years, operating cash flow turned positive, and free cash flow reached positive $109 million in fiscal 2025 on a derived basis. Yet the operating margin was still negative 13.4 percent in fiscal 2025, and the fiscal 2025 operating loss was $309.9 million, confirmed in SEC filings. The distance between a proven unit economy and an unproven income statement is the whole story of this page, and the courtroom is the reason that distance may widen before it narrows.
Both gates pass, but the second passes on a borderline basis, and the distinction is worth stating plainly. Gate G1, sustained growth or a second growth curve, passes on confirmed figures: revenue rose from $1,082.6 million in fiscal 2023 to $1,696.9 million in fiscal 2024 and $2,306.1 million in fiscal 2025, and the second curve is visible in clinical minimal residual disease, which is addressed below. Gate G2, a ten-year market ceiling at least ten times current revenue, passes as an estimate, and only on a summed basis. The bar is set at approximately $28.8 billion, ten times fiscal 2026 estimated revenue of approximately $2.88 billion, the midpoint of guidance of $2.85 billion to $2.91 billion on a press-reported basis. The stricter guidance-based bar is deliberately chosen over the $23.1 billion bar implied by fiscal 2025 confirmed revenue. The company's own United States minimal residual disease addressable market of approximately $24 billion, confirmed in the 10-K, reaches only 83 percent of that bar on its own. The pass depends on adding women's health and organ health as separate markets, plus global minimal residual disease, to reach an estimated combined ceiling of approximately $45 billion or more, about 1.6 times the bar. A reader who wants only the single-segment case should know that it does not clear the bar alone; the G2 verdict is a summed-market verdict, recorded as borderline, with re-examination triggers spelled out in the score file.
The most recent results available at T are the second quarter of 2026, reported on 2026-08-06. Third-quarter 2026 results had not been released at T and are excluded from this assessment; they appear below only as a future marker, with an expected date of 2026-11-05 per secondary sources, unconfirmed.
Speed: growth in the high thirties on a $2.3 billion base, paid for in headcount cost
Growth (A1, 8 of 10) is the strongest speed item, and its evidence is confirmed in SEC filings. Revenue grew 56.7 percent in fiscal 2024 and 35.9 percent in fiscal 2025, reaching $2,306.1 million, then grew 38.8 percent in the first quarter of 2026 to $696.6 million and 37.7 percent in the second quarter to $752.8 million. Sustaining growth in the high thirties on a base above $2 billion is a materially harder feat than the same percentage on a small base, and the score reflects that. Two qualifications keep the item at 8 rather than higher. First, the growth trajectory is decelerating, from 56.7 percent to 35.9 percent on an annual basis. Second, the GAAP net loss continued, at $208.2 million in fiscal 2025, so the growth is not yet accompanied by net profitability. The score file places Natera at the level of AFRM at 8 and below NU at 9, where growth arrived alongside profitability. Fiscal 2026 guidance of $2.85 billion to $2.91 billion, raised by $100 million at the midpoint in the second quarter on a press-reported basis, is management's quantified statement of confidence for the year, and it is labelled as press-reported rather than confirmed throughout this draft.
Capital velocity (A2, 3 of 5) makes a distinction the model insists on: access to capital is not the same as demonstrated speed in raising it. Access itself is at the top of the range. The market capitalisation was approximately $56.7 billion at 2026-10-16 on a press-reported basis, and the share price had risen 116.5 percent over one year on the same basis. But the demonstrated record of raising is thin. The last large equity raise was in September 2023, at $235.8 million net, confirmed in SEC filings. Convertible notes were repaid in full in October 2024, and the credit line showed only $80.3 million drawn, with $20 million of headroom remaining. The company is instead in a self-funding phase, with cash of $1,076.1 million and positive operating cash flow, and the Foresight Diagnostics acquisition, closed on 2025-12-04, was structured as $16.0 million of net cash plus equity and contingent consideration rather than as a large cash outlay. Because this item measures speed of raising rather than ability to raise, Natera scores below companies with a richer recent record of raising, such as NBIS and TEM at 4. The point is not that Natera could not raise capital; it is that the public record does not show it doing so quickly and repeatedly in the recent period.
Hiring and productivity (A3, 2 of 5) is the weakest speed item, and the reason is arithmetic rather than anecdote. Headcount was 6,140 employees at 2025-12-31, confirmed in SEC filings, giving revenue per employee of approximately $376,000 on a calculated basis. That is a low figure for a company in this scoring set, reflecting a laboratory-intensive business, and it sits well below the comparators cited in the score file. More importantly, the direction of cost is adverse. Research and development spending reached $624.1 million, up 54.4 percent, including $127.3 million of additional labour cost, while selling, general and administrative spending reached $1,177.3 million, up 39.9 percent, including $212.6 million of additional labour cost. Both increases dwarf the 15.0 percent increase in test volume in fiscal 2025. When labour cost grows several times faster than volume, operating leverage is negative, and the score records that there is no demonstrated productivity improvement to offset it. The 2 is therefore not a judgement about the quality of the workforce; it is a measurement of a cost structure moving in the wrong direction relative to output.
Share-of-market velocity (A4, 4 of 5) is where speed becomes penetration, and here the evidence is strong. Tests processed rose from 2.50 million to 3.06 million to 3.53 million across the three fiscal years, confirmed in SEC filings, with quarterly volume breaking one million tests in two consecutive quarters: 1,013,600 in the first quarter of 2026 and 1,043,900 in the second. Within that total, the fastest segment is clinical minimal residual disease, at approximately 283,000 units in the second quarter of 2026, up 56 percent year over year on a press-reported basis, with a quarterly net increase of approximately 34,000 units, the largest on record on the same basis. That is the signature of a category leader expanding its position in its fastest segment, reinforced by expanding Medicare coverage indications and two approvals from Japan's Pharmaceuticals and Medical Devices Agency, addressed in the moat section. The fifth point is reserved because no quantified market share is disclosed; the volume trajectory is demonstrated, but the share itself is not numerically stated in the public record.
Moat: a data flywheel with an indirect endpoint, and distribution that runs through payers
Network effects (B1, 7 of 18) begin with an honest negative: Natera has no classical network effect of the kind where each additional user directly increases the value of the product for every other user. What it has instead is a data flywheel, and the score file traces it through observable links rather than asserting it. Higher test volume generates more clinical data; that data supports more than 350 peer-reviewed papers, confirmed in the DEF 14A; the published evidence supports guideline inclusion and payer coverage; coverage drives further volume and improved average selling price. The score file cites the second quarter of 2026 revenue result on a press-reported basis as an instance of this loop in action, with the outcome attributed to improved average selling price and a favourable Signatera mix. A second, patient-level lock-in reinforces the loop: a tumour-informed personalised panel is built for one patient and then used for repeated monitoring of that same patient, so switching assays mid-course is clinically impractical. The score places this in the upper part of the 5 to 9 anchor band for data and ecosystem effects, but below TEM at 9, for a precise reason: the flywheel's endpoint is indirect. The data itself is not directly monetised through a separately disclosed pharmaceutical revenue stream; its commercial payoff arrives through coverage decisions made by others. A flywheel whose final step is a payer's decision is real, but it is one step removed from the company's control, and the score prices that distance.
Distribution scalability (B2, 9 of 18) describes a distribution system that is effective and structurally expensive at the same time. The system has three parts: a direct commercial organisation; payer in-network contracts, which matter because the majority of revenue comes from in-network insurers, with insurer revenue of $2,171.2 million in fiscal 2025 confirmed in SEC filings; and the Constellation cloud licence, under which partner laboratories run tests directly, a lighter-asset channel that earns lower revenue per test but extends reach without building new laboratories. Women's health laboratory partners add a fourth route. The score places this in the upper part of the 5 to 9 anchor band for distribution that depends on paid commercial effort but can expand repeatedly. The discount reflects cost and dependence in equal measure. Selling, general and administrative spending of $1,177.3 million equals 51 percent of revenue, so distribution is structurally heavy. And because a coverage determination functions as the gateway to distribution, the entire channel is ultimately dependent on payer policy decisions. Natera can expand its commercial organisation, but it cannot unilaterally expand the coverage that makes that organisation productive.
Market size (B3, 8 of 12) restates the gate analysis as a scored item, and the same borderline character carries over. The company's United States minimal residual disease addressable market of approximately $24 billion, comprising approximately $21 billion for recurrence monitoring in solid tumours plus immunotherapy response monitoring and approximately $3 billion for blood cancers, is confirmed in the 10-K as a company claim. That figure alone falls short of the approximately $28.8 billion bar. Women's health is a separate market that is not included in that $24 billion, even though Panorama and Horizon together account for the majority of current revenue on a qualitative 10-K disclosure. The global noninvasive prenatal testing market was $7.85 billion in 2025 and is projected at $14.1 billion in 2030, a compound annual growth rate of 12.5 percent, on a press-reported basis from PW Consulting, implying a trajectory toward approximately $25 billion by 2035. Third-party projections for the global liquid biopsy market in 2035 range from $19.9 billion from Global Market Insights to $36.8 billion from SNS Insider, both press-reported, so the oncology axis alone straddles the bar depending on which forecaster is chosen. Organ health adds a further axis, with Prospera transplant monitoring and coverage expansion in 2026 as demonstrated evidence rather than projection. Summed, with a conservative reduction for overlapping market definitions, the score file estimates a combined ten-year ceiling of approximately $45 billion or more, about 1.6 times the bar. The 8, below TEM at 10 where the addressable market reached 5.5 times its bar, records exactly the size of that margin of safety: real, but thinner than the strongest cases, and dependent on summation across axes rather than on any single axis.
Gross margin (B4, 9 of 12) is the most fully demonstrated moat item, and its trajectory deserves to be stated as a sequence rather than a single number. Gross margin rose from 45.5 percent to 60.3 percent and then to 64.7 percent in fiscal 2025, confirmed in SEC filings, and then stabilised at 64.7 percent in the first quarter of 2026 and 64.5 percent in the second. Operating cash flow moved from negative $247.0 million to positive $135.7 million and then to positive $215.3 million, with free cash flow of positive $109 million in fiscal 2025 on a derived basis. That is the material evidence for the blitzscaling claim that scale brings profitability: unit economics have already been proven at scale. The discount from a higher score is equally concrete. The operating margin was still negative 13.4 percent in fiscal 2025 and negative 10.1 percent in the second quarter of 2026, because research and administrative spending below the gross profit line grew fast enough to absorb the margin expansion. The model therefore separates two judgements that a single margin number would conflate: the gross margin itself earns a high score, and the conversion of that margin into operating profit is scored as not yet demonstrated. Both judgements are visible in the same financial statements, and both are needed to understand the company.
Creative destruction: replacing tissue and imaging with blood, one workflow at a time
Creative destruction scores 12 of 15, the highest of the three axes in percentage terms: 80.0 on the 100-point radar conversion, against 68.0 for speed and 55.0 for moat. The disruption thesis (C1, 4 of 5) is that blood-based, tumour-informed minimal residual disease monitoring replaces tissue biopsy plus imaging surveillance as the method for tracking cancer after treatment. Signatera detects recurrence earlier than imaging and quantifies residual cancer, providing the evidence base for adjusting treatment intensity, de-escalating or escalating adjuvant therapy. The displaced order is named and large: tissue testing, imaging, and fixed gene panels. The fifth point is reserved for a reason the score file states directly: at the current stage, blood-based monitoring supplements and precedes imaging in a mixed position rather than fully replacing it across all settings. That is a more complete displacement than a workflow improvement but less complete than the model's fullest cases, such as CRSP at 5, where a single intervention changes the treatment paradigm itself. The distinction is one of degree, and it is honestly recorded.
Irreversible behavioural change (C2, 4 of 5) follows from the same clinical logic, now read as a habit embedded in medical practice. Treatment decisions based on minimal residual disease results, stopping or intensifying adjuvant chemotherapy according to a blood test, have entered the clinical workflow. The institutional evidence for that entry is cumulative Medicare coverage: colorectal cancer, bladder cancer, breast cancer, ovarian cancer, non-small cell lung cancer surveillance, and pan-solid-tumour immunotherapy monitoring, each an indication added to coverage, confirmed in SEC filings and press-reported announcements. At the patient level, the tumour-informed panel's structure creates a lock-in that is clinical rather than contractual: once monitoring has begun on a personalised assay, switching assays mid-course is clinically impractical, so the behaviour is difficult to reverse. The fifth point is reserved because this is a structural lock-in within clinical practice rather than a society-wide change in everyday behaviour, which is what the top anchor requires. Within oncology workflows, however, the change is embedded, and the 4 records that embedding.
Cost-structure change (C3, 4 of 5) is measured through the margin record rather than asserted from first principles. The 19.2 percentage-point improvement in gross margin, from 45.5 percent to 64.7 percent over three years, is the observable trace of falling cost per test, supported by the score file's citation of continued reductions in cost of revenues in the second-quarter 2026 press release on a press-reported basis. The liquid biopsy pathway also changes the cost structure of the diagnostic journey as a whole, relative to repeated tissue sampling, surgery, and imaging. The fifth point is reserved, on the same evidentiary standard applied to TEM, because a dollar-denominated cost per test is not disclosed. The leverage is visible in aggregate margin; it is not yet proven at the level of a disclosed unit cost. The score refuses to convert an aggregate improvement into a unit-cost claim the filings do not support.
Deductions and risks: litigation is half the deduction, dilution is the rest of the story
Debt (D1, negative 3 of 10) begins with a balance sheet that, on debt alone, looks light. Convertible notes were repaid in full in October 2024, the credit line showed $80.3 million drawn with $20 million of headroom, cash stood at $1,076.1 million, and operating cash flow had been positive for two consecutive years, all confirmed in SEC filings. The deduction's substance is not debt but dilution through equity compensation, a point the score file flags as a designated focus. Stock-based compensation was $354.4 million in fiscal 2025, equal to 15.4 percent of revenue, rising from $191.8 million in 2023 through $274.4 million to $354.4 million, faster than revenue itself. Shares outstanding rose from 139.7 million at 2025-12-31 to 143.6 million at 2026-06-30, an increase of 2.8 percent in half a year. A further overhang exists in 11.9 million unexercised shares plus 13.4 million shares available for issuance, and Foresight contingent consideration of $118.4 million, payable in equity over 2026 to 2027, is still to come. There is no offsetting repurchase programme. The negative 3 therefore charges the company not for borrowing, but for funding talent and acquisitions with equity while existing owners absorb the full dilutive effect.
Revenue quality (D2, negative 2 of 10) is a light deduction, and its lightness is itself informative. There are no revenue restatements, no auditor changes, and no audit opinion issues. The two grounds for the deduction are narrower. First, revenue recognition depends on reimbursement estimates: fiscal 2026 guidance is stated on a basis that separately notes the exclusion of true-up adjustments, which indicates that reimbursement true-up volatility is embedded in reported revenue. Second, part of the fiscal 2025 narrowing of the net loss reflects a one-time tax benefit of positive $59.9 million related to the Foresight acquisition, which the score file separates from the operating assessment in B4 and notes here only as a matter of earnings quality. The Guardant litigation judgement is deliberately not double-counted here; it is charged once, under D4, and the score file states that separation explicitly. A reader should therefore not add a litigation discount to this item: the 2 is about estimation and one-time items, not about the courtroom.
Governance (D3, 0 of 5) is the cleanest item in the entire score, and in this scoring set that is rare enough to state plainly. Natera has a single class of common stock, with no dual-class structure. Founder and chair Matthew Rabinowitz owned 4,817,009 shares, or 3.39 percent, mostly in options, confirmed in the DEF 14A filed 2026-04-23. The officer and director group together owned 5.05 percent. The largest institutional owners disclosed were JPMorgan Chase at 9.01 percent and T. Rowe Price at 7.64 percent, both confirmed in the same filing. There is no founder control cluster, no differential voting rights, and no related-party transaction cluster of the kind that drives deductions elsewhere in the scoring set. The contrast the score file draws is direct: MQ at negative 3 with 46.9 percent voting control and TEM at negative 4 with 57.9 percent stand on the opposite side of this question. Natera's zero is a no-trigger result, meaning no governance deduction is triggered at all, and it is one of the few structural strengths in the file that requires no qualification.
Regulatory and social cost (D4, negative 5 of 5) is the maximum deduction, and it is the single most important risk section in this assessment. The Guardant false-advertising litigation was filed in May 2021 in the Northern District of California, proceeded to a jury verdict in November 2024 of $292.5 million against Natera, and on 2025-07-28 the court upheld the verdict on post-trial motions, all confirmed in the 10-K Note 10. Final judgement has not yet been entered, and an appeal to the Ninth Circuit is planned. The verdict alone equals 27 percent of cash of $1,076.1 million and 12.7 percent of fiscal 2025 revenue. A second verdict adds to the exposure: Ravgen, a patent verdict of $57 million in January 2024 for non-wilful infringement, also under planned appeal. Combined, the determined jury verdict exposure is $349.5 million. The score file applies the maximum band precisely because this is no longer an allegation or a filing-stage dispute of the kind scored at negative 3 for BE, but a jury verdict that a court has upheld. Two aggravating factors accompany the verdicts. First, intellectual property losses can create royalty obligations that pressure future gross margin, a risk the 10-K states explicitly. Second, the company faces structural exposure to Food and Drug Administration regulation of laboratory-developed tests and to reimbursement reductions, the same payer dependence that limits distribution scalability. The CareDx litigation is excluded from the net exposure calculation, because its record mixes a determined win for Natera on patent invalidity with a $96.3 million win that was overturned on judgement as a matter of law, but the score file records the density of litigation itself as background. The negative 5 is therefore not a forecast about the appeal; it is a measurement of where the cases stand at T.
Two further balance-sheet facts belong in any honest account of risk, even though they are not separate scored items. The accumulated deficit was negative $2,776.0 million, which limits the extent to which retained earnings can serve as a capital base. And the valuation note, which is separated from the score by design, records that the share price was $393.44 and market capitalisation approximately $56.7 billion at 2026-10-16 on a press-reported basis, with a second source, Finnhub, reporting $58.23 billion, a discrepancy the score file notes rather than resolves. The resulting price-to-sales multiples were approximately 24.6 times fiscal 2025 revenue and approximately 19.7 times fiscal 2026 estimated guidance revenue, with a 52-week range of $172.82 to $437.41, a year-to-date rise of 71.7 percent, and a beta of 1.54. Market capitalisation was approximately 2.0 times the G2 bar of $28.8 billion. Following the BE precedent, the score file separates this valuation question from both the gate verdict and the score: the gates are judged on market ceilings, not on market prices, and the score does not price the equity. The gap between a 52/C business score and a market capitalisation twice the market-ceiling bar is nonetheless the largest asymmetry the score file identifies, and it means that any realisation of the litigation, dilution, or operating-loss risks described above would land on a valuation that already assumes a great deal.
What to watch: the appeal, the cost line, and the coverage map
The score file's framing places Natera at a specific stage: the harvest immediately before blitzscaling's monetisation test, or in its own phrase, margin proven and profit unproven. Revenue of $2.31 billion rising toward guidance of $2.88 billion, a proven gross margin, and positive operating cash flow set the stage. The remaining test is a single conversion, from gross profit to operating profit, and its key is not technology but cost control, since selling, general and administrative spending at 51 percent of revenue is the line that currently absorbs the margin expansion. Whether research spending growth of 54.4 percent and administrative spending growth of 39.9 percent moderate toward the 15.0 percent test-volume growth rate, or continue to outrun it, will determine the timing of that conversion more directly than any single product event.
The appeal is the second test, and it is binary in a way the cost question is not. If the Ninth Circuit appeal overturns the Guardant verdict, the deduction structure changes entirely, with a potential improvement of up to 5 points from D4 alone, before any effect on Ravgen is considered. If the verdicts are confirmed, cash of $1,076.1 million would face an outflow of up to $349.5 million on the combined verdicts, approximately 32 percent of cash on the score file's own calculation, alongside any royalty consequences for future gross margin. The third-quarter 2026 results, expected on 2026-11-05 per secondary sources and unconfirmed, are a future marker only; no outcome is anticipated here, and they are excluded from the score above. The same future-marker treatment applies to any further coverage decisions, including additional Medicare indications and further approvals outside the United States following the two Japan approvals in June and September 2026 on a press-reported basis.
The final picture is the one the score file's key drivers state most compactly. Strip out the courtroom, and a business scoring 62, with a margin ramp from 45.5 percent to 64.7 percent, volume above one million tests in two consecutive quarters, and clinical minimal residual disease growing 56 percent year over year, is a genuine blitzscaling business in its late first act. Add the courtroom back, and the official score is 52: a company whose gross margin has been proven at scale, whose operating profit has not, whose governance is unusually clean, whose equity compensation dilutes steadily without offset, and whose largest single risk is a competitor's verdict that a court has already upheld once. The next chapters will be written less in the laboratory than in the cost accounts and in the appellate court, and the score as it stands is a record of exactly that balance at 2026-10-20.
More Frontier companies
Other Frontier names on the Blitz Index, highest score first: Rocket Lab (62/B), Tesla (62/B), Illumina, Inc. (61/B).
Next earnings
Q4 2026 · Expected
Coverage
Natera, Inc. · Q3 2026 due Nov 5, 2026 (AMC, confirmed) · Score 52 · Grade C
Embed this score
Copy the HTML below to show this score on your site. The badge links back to this page and updates automatically when the score changes.
Preview:
BlitzLab scores businesses against a scholar’s standard — not investment advice. No price targets, no buy/sell recommendations. Figures are from SEC filings (XBRL) as labeled in the source scorecard.