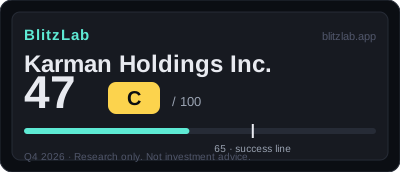
Karman Holdings Inc. — Blitz Index 47 (C)
Karman scores 47 — a $1,322M firm backlog (2.24x TTM revenue) and a 30% EBITDA margin that produces no cash.
Last re-scored: November 5, 2026.
Confidence: High · Category: frontier
Score breakdown
| Section | Score | Detail |
|---|---|---|
| A · Speed | 17 / 25 | TTM revenue $589.6M (+50.2%); Q2 2026 $182.1M (+58.2% YoY) — but organic only +24.4%, the rest acquired |
| B · Moat | 34 / 60 | Sole/single-source subsystem franchise on strategic missile programs; 7-year THAAD LTA ($218M) plus >$1B more in negotiation |
| C · Creative destruction | 9 / 15 | Second-order destruction: enabling the interceptor production ramp and automated manufacturing — displacing no incumbent itself |
| D · BlitzFailing | −13 | Net debt ~$716.7M (≈4.0x LTM adj. EBITDA) after five debt-funded deals in 17 months; top 3 customers 51.5% of FY2025 revenue; negative FCF despite ~30% EBITDA margin |
Think we scored it wrong? Score it yourself →
Radar axes (0–100): Moat 56.7 · Speed 68 · Creative 60.
Watch item
Gates: G1 ✓ · G2 ✓ (estimate — subsystem slices only, never the prime-award headline). 18 points below the threshold — first score. Demerits 13, two points below the FLAG line.
Strengths
- Firm backlog $1,322M (+128% in 18 months, ~69% organic) + Q2 book-to-bill ~2.7x — demand visibility most hardware companies never get
- THAAD 7-year $218M LTA (Lockheed Martin, 2026-10-20) + >$1B of further LTAs in negotiation — backlog turning into multi-year contracted revenue
- Gross margin rising every year (35.8% → 43.0%) with adj. EBITDA stable ~30% — scaling efficiency, not margin giveaway
- Four end markets (Hypersonics / Tactical / Space / new Maritime) with no single program >10% of sales
- Sole/single-source positions on strategic missile programs + vertical integration — a qualification moat that takes years to replicate
- No dual-class stock; single class, one vote per share
Concerns
- Net debt ~$716.7M ≈ 4.0x LTM adj. EBITDA after ~$530M+ of debt-funded M&A in 17 months; term loan now $864M original principal
- Negative free cash flow despite ~30% adj. EBITDA margin (FY2025 ≈ −$42.5M, H1 2026 ≈ −$24.8M) — working capital + capex + interest absorb the margin
- Top 3 customers 51.5% of FY2025 revenue (unnamed); government termination-for-convenience rights; FY2027 interceptor funding partly un-enacted
- Growth quality: only +24.4% organic vs +58.2% total in Q2; FY2025 organic/inorganic split undisclosed; ISP earnout written to zero
- Two C-suite transitions in one year (CEO March 2026, CFO September 2026) + classified board + blank-check preferred + a pledged director stake
- Short public history (IPO February 2025); stock −69% from its 52-week high ($118.38 → $36.65)
Research notes
Thesis: the backlog is the blitz, and acquisitions are the asterisk
Karman Holdings Inc. (NYSE: KRMN) is a subsystem supplier to defense and space primes, and its BlitzLab score for the fourth quarter of 2026 is 47 out of 100, grade C. That total is built from Speed 17 out of 25, Moat 34 out of 60, Creative Destruction 9 out of 15, less Demerits of 13 points: 17 + 34 + 9 − 13 = 47. The grade band for C is 40 to 59, and 47 sits 18 points below the 65-point threshold used in this model. The score is an evaluation against an academic standard, not a judgment about the share price, and the valuation note in the score file is explicitly not reflected in the score.
The single most useful way to read Karman is the one the score file itself offers: the backlog is the blitz, and acquisitions are the asterisk. Firm backlog stood at $1,322 million at 30 June 2026, up from $580 million in the fourth quarter of 2024, an increase of about 128 percent in eighteen months. The file records that about $398 million of that backlog growth is described as organic, at roughly 69 percent, and that the second-quarter book-to-bill ratio was about 2.7 times, against about 1.6 times over the preceding eighteen months. Second-quarter bookings were about $500 million. In other words, orders arriving in a single quarter were roughly two and three-quarter times the revenue recognised in that same quarter, and the order book at mid-year was 2.24 times trailing-twelve-month revenue of $589.6 million, or 1.79 times the midpoint of full-year 2026 guidance. That is unusual demand visibility for a hardware manufacturer, and it is the strongest demand evidence in the scoring pack.
The asterisk matters just as much. Trailing-twelve-month revenue of $589.6 million was up 50.2 percent against the prior trailing period, and second-quarter 2026 revenue of $182.1 million was up 58.2 percent year on year. But organic growth in that quarter was only 24.4 percent, according to the company, so roughly 34 percentage points of the headline growth rate came from acquisitions, principally in the Seemann and Walker era of dealmaking. The full-year 2025 split between organic and inorganic growth is undisclosed in the filings reviewed, which is itself a limit on how far the headline rate can be credited. Full-year 2026 guidance, raised at the second quarter to $730 million to $745 million, implies a midpoint increase of 56.4 percent against full-year 2025 revenue of $471.5 million, and the company states that the guidance excludes future acquisitions. The trajectory from $226.3 million in full-year 2022 to $345.3 million in full-year 2024 and $471.5 million in full-year 2025, a compound annual growth rate of 27.7 percent as calculated in the score file, is therefore real, but it is a trajectory built in part by buying revenue as well as by winning it.
Karman passed both gates in the model, and the way it passed them frames everything that follows. Gate 1, sustained growth or a second growth curve, passed on confirmed evidence: the revenue path above, the backlog path, the raised guidance, and a visible second curve in the form of Maritime Defense Systems, a new fourth end market that contributed $60.0 million in the first half of 2026 and was created by the Seemann acquisition, together with Walker Precision Engineering in the United Kingdom, which closed on 28 August 2026 and opens a European leg. Gate 2, a ten-year market ceiling at least ten times current revenue, passed on estimated evidence only, and the estimate is worth understanding in detail because it is the most honestly qualified part of the file. The bar is about $5.90 billion, ten times trailing revenue of $589.6 million, or a required capturable run rate of about $590 million a year on average over ten years. The file explicitly refuses to use prime-level program values as Karman's addressable market, calling that the "whole DoD market = TAM" error, and instead tests subsystem slices only.
On interceptor programs, the fiscal 2027 United States budget request, not enacted funding, is about $12.2 billion for PAC-3 MSE plus about $11.4 billion for THAAD, or about $23.6 billion a year at prime level. Karman's THAAD shroud unit arithmetic implies roughly $125,000 to $200,000 per shroud, derived from spreading the $218 million seven-year long-term agreement over a production ramp from 96 to 400 units a year, or roughly 1 to 1.5 percent of an approximately $12 million interceptor's prime value for shrouds alone. A blended 2 percent subsystem content share across interceptor programs, covering shroud plus interstage plus propulsion, implies about $472 million a year, or about $4.7 billion over ten years at a flat request run rate. At a 2.5 percent blended slice, interceptors alone clear the bar at about $5.9 billion. At the more conservative 2 percent slice, interceptors at about $4.7 billion plus submarine composites at about $1.5 billion, derived from a 2 percent slice of more than $76 billion in Columbia and Virginia class prime awards as framed by the company, clear the bar before space, launch, or hypersonics are counted at all. Space and launch and hypersonics subsystems add further capturable value, with current segment revenues of about $150 million a year each, but no quantified addressable market is disclosed for them and no figure is claimed for them in the file. The pass is therefore estimate-dependent, with the slice percentage as the key sensitivity, and the fiscal 2027 request is not enacted funding. That qualification is not a footnote to the gate verdict; it is part of the verdict, and it carries directly into the risk section below.
Speed: fast orders, debt-shaped capital, and a share count that barely moved
Speed scores 17 out of 25, made up of Growth 7 out of 10, Capital Speed 3 out of 5, Hiring and Productivity 3 out of 5, and Share Speed 4 out of 5. Converted to the model's radar axes, speed is 68.0 out of 100, the strongest of the three axes, ahead of creative destruction at 60.0 and moat at 56.7. The pattern inside the section is consistent: demand and order momentum are strong, while the financing of that momentum and the evidence for hiring speed are weaker.
Growth at 7, not higher, is the score refusing to pay full price for acquired growth. The headline rates are top-tier, the organic rate is strong but not elite, and eight or more would require sustained organic growth of 40 percent or more with proof, which the file does not have. The distinction is not pedantic. A company growing at 58 percent with 24 percent organic growth is a different machine from a company growing at 58 percent organically: the first must keep finding, funding, and integrating deals to sustain the headline rate, while the second only has to keep winning orders. Karman's second-quarter print is the first kind, and the third-quarter results due on 5 November 2026 after the market close, confirmed by the company on 22 October 2026 and therefore after the scoring date of 24 October 2026, are excluded from this score. They are the first test, in the file's own framing, of whether the backlog converts without another deal. No outcome is anticipated here; the date is recorded as a future marker only.
Share Speed at 4 out of 5 captures the breadth of the order momentum. Backlog moved from $580 million in the fourth quarter of 2024 to $801.1 million at the end of full-year 2025, to $1,000 million in the first quarter of 2026, and to $1,322 million in the second quarter of 2026. The company reported more than 150 customers or programs in the second quarter of 2026, against more than 130 programs in 2025, and states that its largest program accounts for less than 10 percent of sales. That program-level diversification sits inside a customer concentration story that is less comfortable, and the two facts should be held together rather than averaged away: programs are diversified, customers are not, as the deductions section explains. Five out of five is reserved for a measured share gain, and no quantified market-share percentage is disclosed, so 4 is the ceiling the evidence supports. Karman is a subsystem supplier, not the prime contractor, and that structural position caps what share speed can mean even when orders are surging.
Capital Speed at 3 out of 5 is where the financing shape of this blitz becomes visible. Capital access is proven but debt-shaped. The Citi facility began as a $300 million term loan plus a $50 million revolver, the revolver was later upsized to $150 million and was undrawn at 30 June 2026, and the term loan was repeatedly upsized for acquisitions, with a repricing saving about $4 million a year in interest. Equity access is also demonstrated: an initial public offering on 14 February 2025 of 26.5 million shares at $22.00, raising about $147.3 million net, and a secondary offering in July 2025 in which selling stockholders sold shares and the company received nothing. But equity speed is currently impaired in the file's assessment, because the share price, on a press-based price table dated 23 October 2026, had fallen from a 52-week high of $118.38 to $36.65, a decline of 69 percent, and had fallen every month from January through August 2026. Five deals in seventeen months were funded mostly with debt, not with equity speed, and that funding choice is the thread that runs from this section into the debt deduction. The share price and market capitalisation figures in the file are press-based and should be read as such: market capitalisation is about $4.86 billion on the file's own calculation of $36.65 multiplied by 132.53 million shares at the 23 October 2026 close, while a separate data provider's own field shows $4.67 billion on a different share-count basis. Both figures are quoted here because the file quotes both, and the difference is a share-count basis difference, not a disagreement about the business. On the file's calculation, the price-to-sales ratio on trailing revenue is about 8.2 times, and the press-reported price-to-earnings ratio on trailing earnings is about 126 to 136 times, against a net margin of only 3.7 percent in full-year 2025. The business score does not look at price, and neither does this account beyond recording those figures as the file records them.
Hiring and Productivity at 3 out of 5 reflects a respectable hardware profile with an unverifiable hiring rate. The company employed about 1,400 people at 31 December 2025, including 300 multi-discipline engineers, an engineer density of 21 percent, with no union representation. Revenue per employee was about $337,000 in full-year 2025 and about $421,000 on a trailing-twelve-month basis, as calculated in the file. That is respectable for a hardware manufacturer and unremarkable against software-led blitzers, and because headcount growth is undisclosed, hiring speed cannot be verified, so the score stops at 3 rather than rising higher. The point is not that Karman is slow to hire; it is that the filings reviewed do not prove that it is fast.
Moat: a qualification franchise, not a network effect
Moat scores 34 out of 60, made up of Network Effect and Moat 8 out of 18, Distribution Scalability 9 out of 18, Market Size 9 out of 12, and Gross Margin 8 out of 12. This is the weakest radar axis at 56.7 out of 100, and the reason is structural rather than accidental: Karman has no platform network effect, and none is claimed. What it has instead is a qualification moat, and the score treats that moat honestly, as durable but narrower than a true network effect.
The moat item itself, at 8 out of 18, rests on the company's own description in its annual report: Karman states that it often occupies a single or sole-source position on key strategic missile programs, with vertically integrated concept-to-production capability and a heritage of mission success. Long qualification cycles are the barrier: once a subsystem is qualified on a strategic program, replacing the supplier means re-qualifying, which is slow and expensive, and the customer has strong reasons not to do it casually. No network-effect metric is disclosed, and none is invented here. Eight points reflect a hard-to-replicate franchise that is genuinely defensible within its programs, while withholding the higher scores that belong to businesses where each additional customer makes the product more valuable for every other customer. Karman sells components into other companies' platforms; it does not own a platform whose value compounds with users.
Distribution Scalability at 9 out of 18 is the long-term agreement as a scaling vehicle. The headline agreement is the seven-year THAAD long-term agreement worth $218 million with Lockheed Martin, announced on 20 October 2026, four days before the scoring date. The score file also records three additional long-term agreements under negotiation at the second quarter, with combined potential of more than $1 billion, and notes, citing press reporting, that the THAAD agreement was one of the three. Those two framings sit in tension in the file, and both are preserved here rather than reconciled: the company-facing description presents the THAAD agreement plus further agreements under negotiation with combined potential above $1 billion, while the press-based note suggests THAAD was counted among the three agreements originally described. Either way, the direction is clear: long-term agreements convert pipeline into multi-year contracted revenue, and they are the closest Karman has to a distribution channel. Walker in the United Kingdom extends that distribution geographically into European defense. Capacity is being built to match the contracted demand: capital expenditure of $21.9 million in the first half of 2026 already exceeds full-year 2025 capital expenditure of $20.3 million. The discount in the score is equally clear: distribution is prime-gated and capital-intensive, not zero-marginal-cost. The primes, not Karman, control the end customer, and every unit of growth requires physical capacity, materials, and working capital. Nine points credit a real scaling vehicle while refusing to score it as if it were software distribution.
Market Size at 9 out of 12 follows the gate logic. The subsystem slices across four end markets, hypersonics, tactical, space, and the new maritime market, together with production ramps that multiply unit volume, support a ceiling above the bar. The file cites press-reported ramp targets of THAAD production from 96 to 400 units a year and PAC-3 from 600 to 2,000 units a year. Twelve points are reserved for a ceiling orders of magnitude above the bar on confirmed content-per-unit data; here the slice percentage is estimated and one leg of the funding path, the fiscal 2027 request, is not enacted, so the score stops at 9. That restraint is consistent with the gate verdict: the market is large enough on plausible subsystem arithmetic, but the arithmetic itself is the assumption.
Gross Margin at 8 out of 12 is the most encouraging trend in the moat section and the most qualified. Gross margin has risen every year in the file's series: 35.8 percent in full-year 2022, 37.6 percent, 38.3 percent, 40.3 percent in full-year 2025, and 43.0 percent in the second quarter of 2026, with 42.6 percent for the first half of 2026. Adjusted EBITDA margin has been stable at about 30 percent, at 30.8 percent in full-year 2025 and 30.0 percent in the second quarter of 2026, meeting the company's stated commitment of about 30 percent or more made at its initial public offering. The discount is in conversion: GAAP operating margin was 15.5 percent in full-year 2025 and 19.1 percent in the second quarter, well below adjusted EBITDA, and net margin was only 3.7 percent in full-year 2025 and 7.7 percent in the second quarter, because interest of $45.2 million in full-year 2025 consumes most operating profit. Margin quality is real, in the sense that the gross line improves as production scales, but GAAP conversion is weak, and the gap between adjusted and GAAP profit is where the debt story re-enters.
Creative destruction: enabling disruption, not displacing an incumbent
Creative Destruction scores 9 out of 15, with 3 out of 5 on each of its three items: Order Being Replaced, Irreversible Behaviour Change, and Cost-Structure Change. The uniform 3s are not a coincidence; they express a single judgment, applied three ways. Karman is not a classic disruptor story. It displaces no incumbent product. It enables a displacement already underway.
Order Being Replaced at 3 reflects that Karman sits on the new side of a production-model shift rather than on the attacking side of a product displacement. The displacement it enables includes interceptor stockpile replenishment and production ramp for THAAD and PAC-3, hypersonic testing and strategic-missile modernisation including the Next Generation Interceptor program and hypersonic test beds, and the submarine build-up. Its position is the replacement of low-rate, artisanal subsystem production with high-rate, automated manufacturing. The company's own language in the THAAD release, quoted in the file, is that automated processes support repeatable, high-quality production at scale. That is a genuine production-model change, and it is honestly scored as second-order destruction: Karman makes the ramp possible, but the primes and the programs own the disruption narrative.
Irreversible Behaviour Change at 3 rests on lock-in that is genuine but revocable by the sovereign customer. Firm backlog of $1,322 million, the seven-year THAAD agreement, and further long-term agreements under negotiation with potential above $1 billion are real commitments: re-qualifying a sole-source subsystem supplier is slow and expensive, and customers do not undertake it lightly. The cap is in the annual report's risk factors, which the file records plainly: United States government contracts may be suspended, terminated for convenience, reduced, or audited. Fiscal 2027 interceptor funding is also partly un-enacted, so the lock-in is strong but ultimately subject to a customer that can change its mind by law and by budget. Three points credit the contractual reality without pretending that a government order book is as irreversible as a consumer habit or a platform standard.
Cost-Structure Change at 3 is partial evidence, pending better disclosure. Gross margin expansion from 35.8 percent to 43.0 percent alongside automation claims is consistent with improving unit economics as automated production scales, but no unit-cost collapse is demonstrated, and capital expenditure is accelerating, with first-half 2026 spending already above the full-year 2025 total. The cost story is therefore best described as scaling efficiency, not cost disruption. Three points, pending unit-cost disclosure, is the file's wording, and it is the right posture: the margin trend points in the right direction, but a margin trend is not proof that the cost structure of the industry has changed.
Deductions and risks: borrowed money, concentrated customers, and a young public company
Demerits total 13 points, made up of Debt at minus 8 out of a possible minus 10, Revenue Quality at minus 3 out of minus 10, Governance at minus 2 out of minus 5, and Regulatory and Social Cost at 0 out of minus 5. Thirteen points sit two points below the model's FLAG threshold of minus 15. That proximity should be stated factually, as the file states it, and not treated as a FLAG: the file's verdict is explicitly no FLAG, with leverage and concentration named as the watch variables. The distinction matters because a FLAG in this model is a threshold event, not a vibe, and Karman has not crossed it. It is, however, close enough that one more debt-funded deal without cash conversion, or a funding-path shock to THAAD and PAC-3, would put it over, in the file's own assessment.
Debt at minus 8 is the centre of gravity of the whole score. Term-loan principal was $764.0 million at 30 June 2026, upsized by $100 million on 26 August 2026 for Walker, for total original principal of $863,961,000 as stated in the relevant current report. Net debt was approximately $716.7 million, or about 4.0 times trailing-twelve-month adjusted EBITDA of about $179.1 million as calculated in the file. Interest was $45.2 million in full-year 2025, and net interest was $27.9 million in the first half of 2026. The central debt fact, as the file frames it, is cash rather than share count: shares barely moved, from 132.3 million to 132.5 million, while operating cash flow was negative $22.1 million in full-year 2025 and negative $3.0 million in the first half of 2026, despite an adjusted EBITDA margin of about 30 percent. Working capital, capital expenditure, and interest absorb the margin. Free cash flow, as calculated in the file, was approximately negative $42.5 million in full-year 2025 and negative $24.8 million in the first half of 2026. Five debt-funded acquisitions, at more than $530 million in cash plus stock, were completed in about seventeen months, and one acquisition underperformance precedent is on record: the earnout for ISP, worth $5.0 million, was written to zero in 2025 because its EBITDA target was missed. The mitigants are real and are recorded alongside the deduction: maturity on 1 April 2032, a $150 million revolver undrawn at mid-year, repricing saving about $4 million a year, and a leverage covenant ceiling of 6.50 times that has not been triggered. None of those mitigants changes the core observation, which the file states as a single sentence worth repeating: Karman is blitzing on borrowed money and working capital, and interest already eats most operating profit. A 30 percent adjusted EBITDA margin that produces no cash is not a contradiction to be explained away; it is the defining tension of this company at this stage, and the score's largest single deduction is the mechanism by which that tension is priced into the total.
Revenue Quality at minus 3 is a deduction for realised concentration and sovereign risk, not for accounting. No restatement, auditor change, or audit-opinion issue was found in this scoring pass, but the file is explicit that material-weakness status was not extracted in that pass and is recorded as unconfirmed, not assumed clean. That label must be preserved: the absence of a finding is not a clean bill of health, and this account does not upgrade it into one. The deduction itself rests on concentration figures from the annual report notes: three unnamed customers each above 10 percent of revenue accounted for 28.5 percent plus 12.8 percent plus 10.2 percent, or 51.5 percent of full-year 2025 revenue; two customers accounted for 40.7 percent of accounts receivable; and one supplier accounted for 23.8 percent of accounts payable. Government termination-for-convenience rights and the un-enacted fiscal 2027 funding path add live revenue-path uncertainty. The contrast with the program-diversification fact in the speed section is the point: no single program exceeds 10 percent of sales, yet three customers together exceed half of revenue. Program breadth and customer concentration coexist because the same primes buy across many programs, and the risk that matters is the customer relationship, not any single program.
Governance at minus 2 is a comparatively light deduction with a comparatively long list of ingredients. There is no dual-class structure to deduct for: Karman has a single class of common stock with one vote per share, as confirmed in the 2026 proxy statement, so no super-voting deduction applies, and that single-class structure is a genuine positive in a universe where founder control structures are common. The remaining deductions are for a classified board with three staggered classes, directors removable only for cause with a 66 and two-thirds percent vote, board authority to issue up to 100 million preferred shares without stockholder approval, a private-equity platform origin in Trive Capital, two chief-executive and chief-financial transitions in a single year, and one director's shares pledged against a margin loan, as footnoted in the proxy statement. The two transitions are the chief executive change from Koblinski to Rambeau on 23 March 2026 and the chief financial officer change from Willis to Boynton effective 14 September 2026. The Trive point carries its own unconfirmed label: Trive's current holding is unconfirmed, and Trive does not appear as a greater-than-5-percent holder in the 2026 proxy statement's holder table. The file does not claim that Trive still controls the company, and this account does not either. What the governance picture amounts to is a young public company, listed in February 2025 with audited GAAP history running to 2022, that has adopted several standard entrenchment devices while going through unusual leadership turnover in its first full year as a listed company. Two points is a modest deduction for that combination, and it is the smallest of the three non-zero deductions for a reason: none of these items individually blocks the business, but together they reduce the margin for error in a company that already has little cash-conversion margin.
Regulatory and Social Cost at 0 is a no-trigger finding, not an all-clear. No securities litigation, fine, or penalty was confirmed in this pass on the disclosure history reviewed. Government audit and suspension risk and budget politics are real, but they are already reflected in the revenue-quality deduction and are recorded as watch items rather than double-counted here. Zero in this model means no additional deduction was triggered, not that the regulatory environment is benign for a defense supplier whose largest customer is a sovereign government.
What to watch: conversion, funding, and the next deal
The score file's blitzscaling assessment places Karman in blitz act one, in a production-ramp phase: backlog at 2.24 times trailing revenue, guidance implying 56 percent growth at the midpoint, and long-term agreements converting pipeline into contracted years, but a ramp that is not yet self-funding. The company is still, in the file's phrase, in the borrow to build capacity ahead of contracted demand phase. The transition to watch is backlog converting into operating cash flow without a sixth acquisition. That single sentence organises everything that follows, because every open question in this score is a version of it.
The first watch item is cash conversion itself. The question is not whether adjusted EBITDA stays near 30 percent; it has been stable, and gross margin has improved every year in the series. The question is whether operating cash flow and free cash flow turn positive while the company funds working capital for a $1,322 million backlog and capital expenditure that already exceeded the prior full-year total within six months. If the third-quarter results due on 5 November 2026 after the close show conversion improving, the debt deduction's premise weakens. If they show another negative cash-flow period funded by the term loan, the premise strengthens, and the two-point gap to the FLAG threshold narrows. No outcome is predicted here; the marker is the date and the metric, and the metric is cash, not the adjusted margin.
The second watch item is the funding path for interceptor programs. The gate pass and the market-size score both depend on subsystem arithmetic applied to a fiscal 2027 budget request that is not enacted. The file records the fork in press summaries: a discretionary-only path for THAAD of $1.9 billion for 27 units, against $10.5 billion for 830 units as proposed. The gap between those two paths is not a rounding difference; it is the difference between a ramp and a trickle, and it is the reason the file treats funding-path risk as a live variable rather than a background condition. The conversion rate of the backlog, not its headline size, becomes the failure point if funding lands on the lower path, and a company levered at 4.0 times adjusted EBITDA has the least room to wait out a delay. The THAAD long-term agreement, at $218 million over seven years, is contracted, but contracted backlog inside a program whose appropriations are contested is a different asset from contracted backlog inside a fully funded program, and the distinction should be kept in view.
The third watch item is the long-term agreement pipeline. The THAAD agreement is signed and dated 20 October 2026. The further agreements described as under negotiation, with combined potential above $1 billion, are not signed in the evidence reviewed, and the file's press-based note that THAAD was one of the three originally described agreements means the pipeline's incremental size cannot be stated precisely from the file alone. What can be stated is the direction: if further agreements are signed on comparable seven-year terms, the contracted-revenue base lengthens and the distribution score's premise strengthens; if they slip or shrink, the backlog's quality rests more heavily on orders that are firm but shorter-dated. Either outcome is informative, and neither is assumed here.
The fourth watch item is acquisition discipline. Five deals in seventeen months, more than $530 million in cash plus stock, a term loan upsized repeatedly for deals, and one earnout written to zero together describe a roll-up in motion. The file's own warning is that one more debt-funded deal without cash conversion would put demerits over the FLAG threshold. The Walker acquisition, closed on 28 August 2026 and funded with a $100 million term-loan upsize, is the most recent test of that discipline, and its European leg is strategically coherent in the file's account: it extends distribution into European defense and adds a fourth end market's geographic reach. Coherence is not the same as cash generation, however, and the integration burden across five deals in a short period, in a company with a new chief executive since March 2026 and a new chief financial officer since September 2026, is a genuine execution load. The organic growth disclosure in the next print matters here too: if organic growth strengthens toward the headline rate, the roll-up label weakens; if the gap between headline and organic growth persists, the label holds, and Growth at 7 remains the right score.
The fifth watch item is concentration and governance housekeeping. Three unnamed customers at 51.5 percent of revenue, two customers at 40.7 percent of receivables, and one supplier at 23.8 percent of payables are figures that change slowly, and they will not be resolved in a single quarter. They are worth tracking because they define the blast radius of any single relationship change: losing or shrinking one of three customers is not a program event, it is a revenue event. On governance, the items to track are quieter: whether the classified board, blank-check preferred authority, and pledged director stake remain as they are, whether leadership stabilises after two transitions in one year, and whether the material-weakness question left unconfirmed in this pass is ever affirmatively resolved in a future filing review. None of these items changes the score on its own, but together they describe the governance margin around a leveraged growth story.
Karman's 47 out of 100, grade C, is therefore best read as a score of a company in the middle of its first blitz act, with the demand evidence of a much higher-scoring company and the cash and balance-sheet evidence of a much lower-scoring one. The backlog, the long-term agreement model, the sole-source qualification franchise, and the rising gross margin are the reasons the moat and speed sections score as well as they do. The debt-funded acquisition pace, the negative cash flow behind a 30 percent adjusted margin, the customer concentration, and the estimate-dependent market ceiling are the reasons the total stops at 47. The score does not predict which side of that tension resolves first. It prices the tension as it stood on 24 October 2026, with the third-quarter print on 5 November 2026 as the next dated marker, and with leverage and concentration as the named watch variables two points below the FLAG threshold. That is a precise, falsifiable position: conversion, funding, agreements, deals, and concentration are the five things to check, in that order, when the next evidence arrives.
More Frontier companies
Other Frontier names on the Blitz Index, highest score first: Rocket Lab (62/B), Tesla (62/B), Illumina, Inc. (61/B).
Next earnings
Q4 2026 · Expected
Coverage
Karman Holdings Inc. · Q3 FY2026 due Nov 5, 2026 (AMC) · Score 47 · Grade C
Embed this score
Copy the HTML below to show this score on your site. The badge links back to this page and updates automatically when the score changes.
Preview:
BlitzLab scores businesses against a scholar’s standard — not investment advice. No price targets, no buy/sell recommendations. Figures are from SEC filings (XBRL) as labeled in the source scorecard.