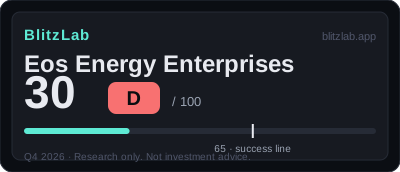
Eos Energy Enterprises — Blitz Index 30 (D)
Revenue 7× but 80% is related-party — the demand may be smoke.
Last re-scored: November 5, 2026.
Confidence: High · Category: power
Score breakdown
| Section | Score | Detail |
|---|---|---|
| A · Speed | 16 / 25 | FY2025 revenue 7.3× to $114M; backlog $807M (+25% QoQ) — but 80% of Q2 sales were related-party |
| B · Moat | 21 / 60 | 2 GWh → 8 GWh (2027) capacity build; third-party channels (MN8·Talen·Golden Dome) nascent |
| C · Creative destruction | 9 / 15 | Zinc-battery long-duration storage; DOE $303.5M Title XVII loan — policy-validated, not yet commercial |
| D · BlitzFailing | −16 | $600M 14.2% convertibles + 2030 springing maturity; ~5-quarter runway; securities class-action probe |
Think we scored it wrong? Score it yourself →
Radar axes (0–100): Moat 35 · Speed 64 · Creative 60.
Watch item
Gates: G1 ✓ · G2 ✓ (borderline — own plan reaches only ~60% of the bar). ⚠️ BlitzFailing watch (D −16).
Strengths
- Revenue 7.3× (FY2025); gross margin −533% → −71% — direction true (absolute losses still widening)
- DOE $303.5M Title XVII loan (first battery loan) + 45X production tax credit — policy validation
- Backlog $807M (+25% QoQ) · pipeline $24.6B; Golden Dome + Department of War channels
- Going-concern doubt lifted (Q4 2025 release, 2026-02-26)
Concerns
- Q2 revenue 80% related-party (Cerberus/FPUSA); top-2 customers 97.7% — demand quality
- $600M convertibles at 14.2% + 2030 springing maturity — expensive, short money; ~5-quarter runway
- Massive dilution overhang (Series B ~131M shares · warrants 44.4M); securities class-action probe (2026-10-06)
- FY2026 guidance cut ($300–400M → $300–350M); short interest 33%, YTD −84%
Research notes
Eos Energy Enterprises is a company that is scaling fast on paper and straining hard underneath it. The top line has multiplied, the order book has grown, and a government loan facility has put real money behind a factory ramp. At the same time, most of the revenue in the latest reported quarter came from a related party, the gross margin was still deeply negative, and the capital structure is built on expensive debt with a large dilution overhang. That tension is the whole story of this score: Eos Energy Enterprises, Inc. (NASDAQ: EOSE) earns 30 out of 100 under the BlitzLab v1.0 model, a grade of D, a full 35 points below the 65-point threshold. It passes both entry gates, so it is scored rather than excluded, but the second gate is a borderline pass, and the deductions section alone removes 16 points, which triggers a FLAG.
The company, founded in 2008 and listed through a SPAC transaction in 2020, makes Znyth and Z3 zinc-bromine aqueous batteries for long-duration energy storage. Its systems are designed for storage durations of four to sixteen hours or more, a segment the score file calls LDES, for long-duration energy storage. The classification in the score file is GROWTH, meaning revenue below one billion dollars at an early commercial scale. That framing matters for everything that follows: this is not a mature manufacturer being judged on steady profitability, but a young industrial company being judged on whether its early scale-up looks like the beginning of a durable position or like a ramp financed by borrowed money and related-party demand.
The thesis, in one paragraph, is that Eos has demonstrated that it can build and ship a differentiated battery, and has not yet demonstrated that it can do so profitably for independent customers. Revenue rose from 15.606 million dollars in fiscal 2024 to 114.203 million dollars in fiscal 2025, an increase of 632 percent, or about 7.3 times. In the first half of 2026, revenue of 125.738 million dollars already exceeded the whole of fiscal 2025. The gross margin improved dramatically over the same period, from negative 533.4 percent in fiscal 2024 to negative 70.9 percent in the second quarter of 2026. Yet the direction of the margin is the only part of that sentence that is encouraging, because the level is still a loss of about seventy-one cents on every dollar of revenue, and the absolute adjusted EBITDA loss widened from 156.6 million dollars in fiscal 2024 to 219.1 million dollars in fiscal 2025. Growth this fast, at margins this negative, is a race between commercial proof and the cash balance, and the score file is explicit that the cash balance gives the company roughly five quarters of runway on the second-quarter adjusted EBITDA loss basis.
The score at a glance
The BlitzLab v1.0 model scores three positive sections and subtracts a deductions section. Speed, section A, is worth 25 points, and Eos scores 16. Moat, section B, is worth 60 points, and Eos scores 20. Creative destruction, section C, is worth 15 points, and Eos scores 9. Deductions, section D, subtract 16 points. The arithmetic is 16 plus 20 plus 9 minus 16, which equals 29. Converted to the three-axis radar view used by the model, the moat axis stands at 33.3 out of 100, the speed axis at 64.0, and the creative-destruction axis at 60.0. The shape of that radar is itself informative: this is a company with respectable speed and creative-destruction readings and a moat reading that lags far behind, dragged down by weak network effects and a deeply negative gross margin.
The two gates come before the score. Gate G1 asks for evidence of product-market fit, defined for a growth company as meeting at least two of four tests: repeat purchases, net revenue retention, organic growth, or backlog. Eos passes on three. There were two repeat-purchase customers in the second quarter of 2026, an existing utility expanded from four hours to ten hours of storage, and customers upgraded to the DawnOS software in the first quarter. Organic growth is visible in the revenue path from 15.6 million dollars to 114.2 million dollars and then to 125.7 million dollars in half a year. The backlog stood at 807 million dollars, or 3.4 gigawatt-hours, up 25 percent quarter on quarter. Gate G1 is therefore recorded as a confirmed pass, with a quality caveat that matters greatly: 80 percent of second-quarter revenue came from a related party, and the top two customers accounted for 97.7 percent of that quarter's revenue. The score file treats that concentration as a question about the quality of demand, not about whether the business exists, because third-party contracts also exist, including a 750 megawatt-hour master supply agreement with MN8, an exclusive distribution agreement with CAPAC, multi-gigawatt-hour cooperation with Talen, and defense work under the Golden Dome program. The gate passes; the concentration is punished in the item scores instead.
Gate G2 asks whether the ten-year market ceiling is at least ten times current revenue. The bar is set from fiscal 2026 estimated guidance of 300 to 350 million dollars, multiplied by ten, giving 3.0 to 3.5 billion dollars, with a midpoint of 3.25 billion dollars. The addressable market used for the test is the global long-duration storage market, estimated at 12.34 billion dollars in 2030 by TechSci, on a press-reported basis, growing at a compound annual rate of 12.9 percent. Against that 2030 market, the midpoint bar requires about 26.3 percent share, rounded to 27 percent in the score file. Extended to 2036 at the same growth rate, the market would be about 25.5 billion dollars, and the required share would ease to about 13 percent. The company's own plan does not reach the bar on its own: eight gigawatt-hours of capacity in 2027, multiplied by the backlog unit price of roughly 237 thousand dollars per megawatt-hour, derived by dividing 807 million dollars by 3.4 gigawatt-hours, gives a revenue equivalent of about 1.9 billion dollars, only about 60 percent of the bar. Reaching the bar would require capacity beyond eight gigawatt-hours, higher prices, or demand from data centers and defense that expands the market beyond the defined long-duration segment. The gate is recorded as a borderline pass on an estimated basis, because the optimistic scenario is arithmetically possible rather than impossible. The score file contrasts this with earlier cases in which the optimistic ceiling fell below the bar as a matter of arithmetic; Eos is difficult, not impossible, and the file flags refinement of the market definition as a candidate for a future model version.
Speed: growth is real, and the base was small
Growth, item A1, scores 8 out of 10, the highest single item score in the file, and the evidence justifies it with a warning attached. Fiscal 2024 revenue of 15.606 million dollars grew to 114.203 million dollars in fiscal 2025, and the first half of 2026 alone produced 125.738 million dollars. The quarterly path shows a ramp rather than a single spike: 30.5 million dollars in the third quarter of 2025, then 58.0 million dollars in the fourth quarter, then 57.0 million dollars in the first quarter of 2026, an increase of 445 percent, and then 68.775 million dollars in the second quarter, an increase of 351 percent against a base of 15.2 million dollars. That is a genuine production ramp, and the score file credits it as top-tier growth.
Three discounts keep the item at 8 rather than the maximum. The first is the low base: multiplying a small number is easier than multiplying a large one, and the score file insists that this be noted. The second is guidance: fiscal 2026 guidance was lowered on August 5, 2026, from a range of 300 to 400 million dollars to a range of 300 to 350 million dollars, with the timing of the Thorn Hill integration cited. A lowered range during a ramp is not a collapse, but it is a signal that the ramp is not running ahead of plan. The third discount is the quality of the growth, which is scored separately under deductions: 80 percent of second-quarter revenue came from a related party. Growth itself earns 8; the quality of that growth is where the score takes points back.
Capital velocity, item A2, scores 3 out of 5. Eos can raise money, and the file lists an extensive record of it: a 600 million dollar senior convertible instrument issued in November 2025 at a coupon of 14.2 percent and maturing in 2031, a 50 million dollar convertible instrument at 7.8 percent, a rights offering of 37.7 million dollars in August 2026, a 303.5 million dollar Department of Energy facility from which a second tranche of 87 million dollars was drawn on September 14, 2026, and a 201.4 million dollar delayed-draw term loan from Cerberus. Access to capital is not the problem. The price of capital is the problem. A 14.2 percent coupon is expensive money by any standard, and it sits alongside a large dilution overhang in the form of Series B preferred shares convertible into approximately 131 million shares and warrants covering 44.4 million shares. The score file's phrase is precise: the company can reach capital, but it reaches it expensively, and 3 out of 5 reflects that distinction.
Hiring and productivity, item A3, also scores 3 out of 5. The company employed 787 people, all full-time, as of December 31, 2025. Hiring for four-shift operation at the second production line in Thorn Hill was underway, which is consistent with a ramp rather than a retrenchment. Revenue per employee in fiscal 2025 was approximately 145 thousand dollars, a figure appropriate to early-scale manufacturing. The productivity signal in the file is that cycle time on the second line improved by 10 to 11 percent compared with the first line. That is a real operational improvement, and it supports a middle score, but it is not yet evidence of a mature, high-productivity factory.
Share velocity, item A4, scores 2 out of 5, the weakest speed item. Eos does not disclose a market share figure within the long-duration storage market, and the score file notes that in a segment this early, share itself is barely meaningful. Cumulative discharged energy rose from 6.0 gigawatt-hours in the first quarter to 6.5 gigawatt-hours in the second quarter, an increase of 0.5 gigawatt-hours. The capacity target is eight gigawatt-hours in 2027, against about two gigawatt-hours today. With no demonstrated share figure and a lowered guidance range, the item earns 2. Speed as a whole, at 16 out of 25, therefore describes a company that is growing quickly in absolute terms but has not yet converted that growth into a measured market position.
Moat: wide channels, narrow demand
Network effects, item B1, score 3 out of 18, and the reason is structural. Eos sells hardware, and hardware businesses rarely generate the self-reinforcing user networks that software platforms do. The score file places this item in the lowest anchor range. The counterweight, and the reason the score is 3 rather than lower, is DawnOS, the battery management, control, and analytics software launched in November 2025. As the installed base grows, DawnOS is an attempt to build software value on top of the hardware fleet. The early signals are modest but real: two repeat-purchase customers in the second quarter, an existing utility expanding its duration, and DawnOS upgrades in the first quarter. Those are the first signs of an ecosystem effect, not an ecosystem. A reader should not mistake a software layer for a network; the score does not.
Distribution scalability, item B2, scores 7 out of 18, and this is the most interesting moat item because the channel list is genuinely broad while the revenue behind it is narrow. The channels include a joint venture with Cerberus and Hudson Bay known as FPUSA, with a two-gigawatt-hour firm reservation, 263 million dollars raised, more than one billion dollars of deployable capital, a sixteen-gigawatt-hour pipeline, and a 100 million dollar purchase order for the first phase of the Blanquilla project. They also include a Golden Dome for America contract and a strategic partnership with the Department of War, both dated August 2026, a 750 megawatt-hour master supply agreement with MN8, multi-gigawatt-hour cooperation with Talen, and an exclusive distribution master supply agreement with CAPAC covering Germany, Austria, and Switzerland. The score file applies a strong discount, as instructed, because 80 percent of second-quarter revenue came from a related party and the top two customers accounted for 97.7 percent. Nearly half of the backlog, 49 percent, is FPUSA-related. An observed backlog-to-revenue conversion rate of 16.7 percent is recorded, with the caveat that it rests on a precedent from another company and carries a low binding grade, meaning it should be read as an indication rather than a rule. The conclusion is balanced: the breadth of channels earns points, but a distribution system that depends on two customers and an affiliate is not yet a distribution advantage, and 7 reflects that.
Market size, item B3, scores 7 out of 12. This item mirrors the gate G2 analysis: the global long-duration storage market of 12.34 billion dollars in 2030 is large enough to pass the gate on an extended horizon, but it is not a market measured in the hundreds of billions, and the bar consumes about 27 percent of it by 2030, or about 13 percent by 2036 on the extended calculation. Demand from data centers through Talen and from defense through Golden Dome could widen the market beyond the defined segment, and that possibility supports the score. But a market of roughly twelve billion dollars cannot support a maximum moat score for a company that still needs more than a quarter of it within a few years, and 7 is the honest middle of that tension.
Gross margin, item B4, scores 4 out of 12, and the score file treats this item as the decisive judge of the whole case. The margin trajectory is as follows: negative 533.4 percent in fiscal 2024, negative 125.9 percent in fiscal 2025, an improvement of 408 percentage points, then negative 111.2 percent in the third quarter of 2025, negative 93.8 percent in the fourth quarter, negative 77.9 percent in the first quarter of 2026, an improvement of 16 percentage points quarter on quarter, and negative 70.9 percent in the second quarter of 2026, an improvement of 132 percentage points year on year and seven percentage points quarter on quarter, with an adjusted margin of negative 62.4 percent. The direction is unambiguously improvement, and the pace of improvement is fast. The level, however, is still a deep loss, and the absolute adjusted EBITDA loss widened even as the margin rate improved, from negative 156.6 million dollars in fiscal 2024 to negative 219.1 million dollars in fiscal 2025. Operating leverage has not yet appeared. Warranty provisions also rose, from 9.5 million dollars to 12.7 million dollars, which the file reads as a structural project cost rather than a one-off. The score file's distinction is worth preserving exactly: this is margin loss narrowing, not margin proof. The atlas lesson cited in the file is that margin separates genuine breakouts from false ones, and on that test Eos remains in the unproven zone. Moat as a whole, at 21 out of 60, is therefore the weakest section relative to its weight, and it is the main reason the total sits at 30 rather than nearer the threshold.
Creative destruction: a real chemistry, an early displacement
The creative-destruction section scores 9 out of 15, with each of its three items at 3 out of 5. That uniformity is itself a statement: every dimension of disruption is present in early form, and none is yet proven at scale.
Item C1, the order being displaced, scores 3. The Znyth and Z3 chemistry is zinc-bromine aqueous technology, which is non-flammable, uses no rare earths, and stores energy for four to sixteen hours or more, against lithium-ion systems that typically serve four to six hours of short-duration storage. The displacement target is clear: short-duration lithium-ion battery storage and diesel peaker plants. The evidence includes cumulative discharged energy of 6.5 gigawatt-hours and a round-trip efficiency of 84.6 percent for the Z3 system at a Department of Defense site. There is also a structural cost advantage in the form of the Inflation Reduction Act section 45X production tax credit, worth 35 dollars per kilowatt-hour for cells, ten dollars per kilowatt-hour for modules, and ten percent for electrodes. The chemistry is differentiated and the target is legible, but the revenue evidence of displacement is still early, and 3 reflects that stage.
Item C2, irreversible behavior change, also scores 3. Existing utilities expanding from four hours to ten hours of storage and upgrading to DawnOS are evidence that customers are changing how they use storage, moving toward longer durations rather than simply buying more of the same short-duration product. Two repeat-purchase customers in the second quarter point in the same direction. Defense work under Golden Dome and the Department of War partnership represents an attempt to standardize long-duration storage at defense facilities. Behavior change is underway, in the score file's wording, which is a stage short of established. The item earns 3 because the change is visible in customer actions but not yet locked in across a broad customer base.
Item C3, cost-structure change, scores 3 as well. The 45X credit is a structural advantage because it scales with production volume: the more the company produces in the United States, the larger the credit. The second production line's cycle-time improvement of 10 to 11 percent is early operational evidence of a changing cost structure. A next-generation architecture called Indensity, with a target of one gigawatt-hour per acre, points to further density gains. None of this has yet produced a positive gross margin, so the item cannot score higher, but the ingredients of a cost-structure shift are present, and 3 records them without overstating them.
Deductions and risks: expensive money, concentrated revenue
Deductions total negative 16, and each item deserves separate attention because they interact. Debt, item D1, subtracts 8 points, the largest single deduction. Total borrowed principal is 948.3 million dollars, against a book value of 617.1 million dollars. The components are a 201.4 million dollar Cerberus delayed-draw term loan from a related party, 96.9 million dollars from the Department of Energy, a 50 million dollar convertible instrument at 7.8 percent, and a 600 million dollar convertible instrument at 14.2 percent maturing in 2031. Both the delayed-draw loan and the Department of Energy loan carry springing maturity provisions that could bring maturity forward to March 14, 2030. Cash fell from 624.6 million dollars at the end of 2025 to 364.1 million dollars at June 30, 2026, with quarterly cash consumption of 152 million dollars in the first quarter and 108 million dollars in the second quarter. On the second-quarter adjusted EBITDA loss basis, the score file estimates runway of about five quarters. A Department of Energy covenant requires minimum cash of 15 million dollars. The dilution overhang described earlier, approximately 131 million shares from Series B preferred shares and 44.4 million shares from warrants, sits on top of this debt. There are two genuine offsets, and the file records both: the going-concern doubt that once hung over the company was resolved in the fourth-quarter 2025 release of February 26, 2026, which stated that it no longer exists, and the Department of Energy loan passed a first political-risk test when the second tranche of 87 million dollars was drawn after a reorganization of the department's energy programs. Even with those offsets, the verdict is that the money is expensive and short-dated, and negative 8 follows.
Revenue quality, item D2, subtracts 5 points, and it is the deduction that most directly qualifies the growth story. In the second quarter of 2026, 80 percent of revenue, or 55.0 million dollars out of 68.775 million dollars, came from a related party, namely Cerberus-affiliated FPUSA projects that predate the current period. The top two customers accounted for 97.7 percent of second-quarter revenue, compared with 70.3 percent in fiscal 2025 and 83.8 percent in fiscal 2024. Concentration at this level means that the loss or delay of one relationship would remove most of the revenue base. A further item is recorded on a press-reported basis: a securities class-action investigation was underway, with the latest notice dated October 6, 2026, and the score file notes that separate confirmation against the annual report's legal proceedings disclosure would be needed. No revenue restatement and no auditor change have been disclosed. Related-party concentration plus an ongoing investigation produce negative 5.
Governance, item D3, subtracts 2 points. Insider ownership is low at 1.73 percent. Insider sales in the recent ninety-day window totaled 626,655 shares for 2.34 million dollars, on a press-reported basis. The chief commercial officer changed in August 2026, with Buczkowski succeeding Kroeker, as disclosed in an August 25, 2026 filing. The chief executive, Mastrangelo, has served since the SPAC period, providing continuity at the top. Low insider ownership, recent insider sales, and a senior commercial leadership change together justify a modest deduction of negative 2, rather than a severe one, because none of these items individually indicates a governance failure.
Regulatory and social cost, item D4, subtracts 1 point. Short interest stood at about 33 percent, and the share price had fallen 84.1 percent year to date as of October 16, 2026, trading near its fifty-two-week low. Market data dated October 16, 2026, on a press-reported basis, put the share price at 1.82 dollars and the market capitalization at approximately 663 million dollars, against a fifty-two-week range of 1.81 to 19.86 dollars. The score file treats market signals as context rather than as a scoring input as a matter of principle, and reflects them only lightly here. No confirmed regulatory action is recorded, which is why the deduction is only negative 1. The market, in other words, is pricing the liquidity, dilution, and refinancing risks that the deductions section describes, but the score itself rests on the company's filings and reported operating figures, not on the share price.
Blitzscaling fit: a policy-and-capital heavyweight
The score file's blitzscaling analysis places Eos in a distinct category: a policy-and-capital heavyweight, a company whose blitz is built on government loans, tax credits, and affiliated financing rather than on a software network or on customer prepayments. The main growth lever is capital plus policy. Department of Energy lending, the 45X production credit, and Cerberus financing are the fuel for building factory capacity from two gigawatt-hours toward eight gigawatt-hours in 2027. The secondary lever is distribution through channels: the FPUSA joint venture, defense work, utilities such as MN8 and Talen, and overseas distribution through CAPAC. The weak lever is network effects, a structural limitation of a hardware business that DawnOS is only beginning to address.
The trade-off between speed and efficiency is stark. Eos chose speed first and efficiency later, and it is paying for that speed with other people's money. The factory runs while the gross margin is negative 71 percent. The fuel is Department of Energy money, Cerberus money, and convertible market money, the last of it at 14.2 percent. The score file draws a contrast with a model in which customers fund the build-out; here, borrowed money funds it, and expensive borrowed money at that. Margin improvement has been rapid in percentage-point terms, from negative 533 percent to negative 71 percent, yet the absolute loss has grown, which is the classic signature of an early manufacturing blitz before operating leverage appears.
The stage assessment is that Eos is in the production-scale phase of its first blitz, but with the fuel gauge in the red zone. Revenue is growing sevenfold, but cash covers about five quarters on the stated basis. Within the next twelve months, the file argues, at least one of three things must appear: further demonstrated improvement in gross margin, a reversal in the share of revenue coming from independent third parties, or a refinancing. Without one of those, the blitz stalls. The single largest risk, in the score file's judgment, is that demand itself is related-party demand. Eighty percent of quarterly revenue and 49 percent of the backlog trace to the Cerberus and FPUSA orbit. Related-party demand can function as fuel, but it can also function as stage smoke: if it stops, it stops everywhere at once. The race is whether third-party channels, including MN8, Talen, CAPAC, and Golden Dome, dilute that concentration before liquidity runs short. The score file also records a pipeline of 24.6 billion dollars alongside the 807 million dollar backlog, which shows the breadth of potential demand, but a pipeline is not a backlog, and a backlog concentrated in one orbit is not yet a diversified order book.
What to watch
Several markers will show whether this story changes, and each should be read as an open question rather than an expected outcome. The third-quarter 2026 results had not been reported as of the scoring date of October 18, 2026, and were excluded from this score; they are the next reported quarter to examine, with the timing described in the score file as expected around early November on a company-unconfirmed basis. The production ramp at Thorn Hill is the second marker: whether the second line sustains its cycle-time advantage and whether capacity moves from about two gigawatt-hours toward the eight-gigawatt-hour target for 2027. The third marker is the mix of revenue: whether the share from independent third parties rises and whether the top-two customer concentration falls from the 97.7 percent recorded in the second quarter. The fourth marker is margin: whether the gross margin continues its climb from negative 70.9 percent toward breakeven, and whether the absolute adjusted EBITDA loss stops widening as volume grows. The fifth marker is financing: further Department of Energy tranche draws, the path to the March 14, 2030 springing maturity date, and any refinancing of the 14.2 percent convertible instrument. The sixth marker is the defense channel: whether Golden Dome and the Department of War partnership convert into repeatable orders rather than a single strategic announcement. The seventh marker is the legal item recorded on a press-reported basis: whether the securities class-action investigation progresses, is resolved, or is confirmed in a filing. None of these markers has an anticipated outcome in this draft, and none is scored here; they are simply the places where new evidence would most change the assessment.
Eos Energy Enterprises, at 30 out of 100, is a company with a differentiated chemistry, a genuinely fast ramp, and a policy tailwind, held back by a moat that has not yet formed, a margin that has not yet turned, and a revenue base that still belongs mostly to its own orbit. The score is not a verdict that the technology fails; the chemistry, the efficiency data, and the production improvements are all recorded as real. It is a verdict that blitzscaling, as a strategy, requires more than growth: it requires growth that survives contact with independent customers, with positive unit economics, and with a capital structure that does not demand refinancing before the proof arrives. On the evidence available as of October 18, 2026, Eos has the first part in abundance and the rest still to prove.
For education and research purposes only.
More Power & Energy companies
Other Power & Energy names on the Blitz Index, highest score first: Solaris Energy Infrastructure (59/C), Bloom Energy (58/C), Forgent Power Solutions (50/C).
Next earnings
Q4 2026 · Expected
Coverage
Eos Energy Enterprises, Inc. · Q3 2026 due ~Nov 4, 2026 (expected) · Score 30 · Grade D · ⚠️ BlitzFailing watch
Embed this score
Copy the HTML below to show this score on your site. The badge links back to this page and updates automatically when the score changes.
Preview:
BlitzLab scores businesses against a scholar’s standard — not investment advice. No price targets, no buy/sell recommendations. Figures are from SEC filings (XBRL) as labeled in the source scorecard.