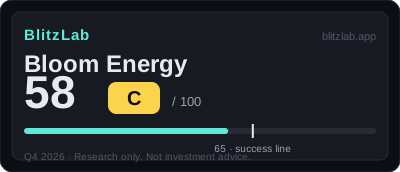
Bloom Energy — Blitz Index 58 (C)
First $1B quarter; margins proved while the backlog's binding power is still unproven.
Last re-scored: October 22, 2026.
Confidence: High · S&P 500 · Category: power
Score breakdown
| Section | Score | Detail |
|---|---|---|
| A · Speed | 21 / 25 | Q3 2026 $1.24B (+138.1% YoY) — fifth straight quarterly record; FY2026 guidance raised 4× to $4.4–4.6B (~+122%) |
| B · Moat | 37 / 60 | SOFC category pioneer; GAAP GM 33.8% (+40bp QoQ), product GM 37.9%; Rystad (3rd party): 40% of US DC capacity seeks on-site power by 2030 — audited RPO $419M vs $20B claimed backlog |
| C · Creative destruction | 9 / 15 | Utility-as-channel (AEP); grid-interconnection bypass is the product |
| D · BlitzFailing | −9 | Net cash +$31.7M (was −$164M net debt); related-party revenue 44%; share count +22.2% in 2025, +5.5% in 9M 2026 via convertibles; scandium allegation + securities class action |
Think we scored it wrong? Score it yourself →
Radar axes (0–100): Moat 62 · Speed 84 · Creative 60.
Watch item
Gates: G1 ✓ · G2 ✓ (borderline — binding-backlog premise). Market cap $65.3B exceeds the G2 bar ($40.5B) — business score and price are separate risks.
Strengths
- Q3 2026 revenue $1.24B (+138.1% YoY) — fifth straight quarterly record; product revenue +179.4%
- FY2026 guidance raised 4× → $4.4–4.6B (~+122% YoY); gross margin 14.8% → 33.8% over 2.5 years
- Customer prepayments + deferred revenue $445M → $754M in one quarter (+$309M) — demand's leading indicator
- All major US hyperscalers + 12 neoclouds/AI labs validated (CEO); S&P 500 inclusion 2026-09-21
Concerns
- $20B backlog is company-defined, unaudited — audited RPO is $419M (48× gap); binding conversion unproven
- Related-party revenue 44% (Brookfield JV alone 43%) — concentration deepened from 23%
- Scandium: Hunterbrook China-dependence claim + securities class action (2026-07-31); share count +22.2% in 2025, +5.5% in 9M 2026 (convertible conversions)
- Market cap $65.3B exceeds the G2 bar ($40.5B) — price and business are separate risks
Research notes
Thesis: speed is the product
Bloom Energy Corporation, founded in 2001 and listed on the New York Stock Exchange on 25 July 2018, builds the Energy Server, a solid oxide fuel cell system that generates power on site from natural gas, biogas, or hydrogen. In the BlitzLab v1.0 framework the company is classified as a growth company, and its current score is 58 out of 100, grade C, made up of Speed 21 out of 25, Moat 37 out of 60, Creative Destruction 9 out of 15, and deductions of 9 points. The score is seven points below the 65-point threshold, and no FLAG applies, because total deductions of 9 fall below the 15-point FLAG trigger. This draft reflects the rescored state after third-quarter 2026 results, released after the market close on 22 October 2026 with a company 8-K release and a 10-Q filed the same day. The rescore moved Bloom from 55/C to 58/C, an increase of three points, and that movement itself is part of the story: one point came from growth, one point from gross margin, and one point from the balance sheet turning from net debt to net cash. None of those three moves, on its own, explains Bloom. Together they describe a company whose central claim is unusually concrete for a hardware business in the middle of a demand surge: power delivered in about ninety days, in a market where a grid connection can take five to seven years.
That contrast is the thesis against which every item in the score file should be read. Bloom does not ask a data centre developer to wait for the grid. It offers a box that can be installed on site, fuelled flexibly, and scaled in increments. If the grid were fast, cheap, and unconstrained, that offer would be a convenience. Where the grid is slow and constrained, and where artificial intelligence workloads are arriving faster than transmission can be built, the offer becomes a schedule. The score file treats that schedule advantage as both a distribution mechanism and a moat, and it is careful to distinguish what is proven from what is merely announced. Framework agreements, press-reported expansions, and a company-defined backlog are not treated as equivalent to binding orders or audited remaining performance obligations. That discipline matters more for Bloom than for most companies in this programme, because the gap between the headline backlog and the audited figure is very large, and because a single related-party relationship accounts for a very large share of revenue. The business, in other words, is genuinely fast, genuinely expanding its margins, and genuinely exposed to questions about how much of its announced demand is contractually locked in.
The gate verdicts frame the rest of the assessment. Gate G1, sustained growth or a second growth curve, passes on confirmed figures. Gate G2, a ten-year ceiling in a new market at least ten times current revenue, passes on an estimate built from third-party research rather than from company or partner claims. The G2 bar is set at roughly 40 to 41 billion dollars, derived from the fiscal 2026 guidance midpoint of 4.05 billion dollars at the earlier as-of date, multiplied by ten. The optimistic ceiling in the score file is about 115 billion dollars, or about 2.8 times that bar, and even a more conservative twenty percent share assumption produces about 76 billion dollars, or about 1.9 times the bar. Those are estimates, not forecasts of Bloom's revenue, and they rest on a third-party market path rather than on the company's own statements about a power gap. The score file explicitly rejects using the company's public relations claim of a 35 gigawatt data centre power gap over five years, or a partner's 75 gigawatt shortage outlook, as standalone evidence for market size, and it likewise declines to convert the company-defined backlog into a market-size input. That restraint is a strength of the scoring, and it should be kept in mind whenever the larger numbers in this draft are quoted: the market case is borrowed from independent research, and the company case must still be proven order by order.
Speed: five consecutive quarterly revenue records
The speed section of the score, 21 out of 25, is the strongest part of Bloom's profile on a converted basis, at 84.0 on a 100-point scale. The headline figure is third-quarter 2026 revenue of 1,235.8 million dollars, up 138.1 percent year on year and the largest quarterly revenue in the company's history. That result extended a run of five consecutive quarterly revenue records, following second-quarter 2026 revenue of 1,065.4 million dollars, up 165.5 percent year on year, which had itself been the first quarter above one billion dollars. The sequence recorded in the score file runs from the third quarter of 2025, up 57.1 percent, through the fourth quarter, up 35.9 percent, the first quarter of 2026, up 130.4 percent, and the second quarter, up 165.5 percent, before the third quarter's 138.1 percent increase. Fiscal 2025 revenue was 2,024.0 million dollars, up 37.3 percent, so the 2026 acceleration is not a single quarter's spike but a step change in the revenue run rate, sustained across several quarters and across a rising base.
Product revenue tells the same story with even greater force. In the third quarter of 2026, product revenue reached 1,073.6 million dollars, up 179.4 percent year on year and accounting for 87 percent of total revenue. A hardware company growing product revenue at that pace is, by definition, shipping at a very different rate than it was a year earlier, and the score file rewards that with the maximum growth subscore of 10 out of 10. Guidance moved in the same direction. Fiscal 2026 guidance had already been raised three times in succession to a range of 3.9 to 4.2 billion dollars, a midpoint of 4.05 billion dollars, or about 100 percent growth year on year. With third-quarter results, guidance was raised a fourth time, to 4.4 to 4.6 billion dollars, a midpoint of 4.5 billion dollars, or about 122 percent growth year on year. The chief financial officer described the earlier sequence as the third raise of the year, and the score file notes that the fourth raise arrived after the earlier as-of date, which is why the rescore adds a point for growth. Guidance is a company statement, not a delivered result, but four raises in one year, each accompanied by a record quarter, carry more weight than a single optimistic outlook.
Two forward indicators reinforce the revenue picture without removing its caveats. The company-defined total backlog is about 20 billion dollars, with a product backlog of about 6 billion dollars, up 2.5 times year on year. Those figures are explicitly labelled as company-defined and unaudited in the score file, and no updated third-quarter figure for backlog was secured from press coverage at the time of scoring, so they should be quoted with that label attached. Customer advances and deferred revenue, a balance-sheet figure rather than a company-defined backlog, moved from 143.8 million dollars to 445.0 million dollars over six months, a 3.1-fold increase, and then to 754.4 million dollars in the third quarter, an increase of 309 million dollars in a single quarter, or about 1.7 times the prior figure. Advances are money received before delivery, and a rising advances balance is a useful, if incomplete, sign that customers are committing cash as well as words. The score file also records an external validation of a different kind: Bloom joined the S and P 500 index on 21 September 2026, following an announcement on 4 September 2026 reported in the press. Index inclusion does not change the physics of a fuel cell, but it does mark a transition from a specialist supplier to a large-capitalisation company, and it widens the audience that must now form a view on the backlog question.
Capital access, scored 4 out of 5, supports the speed story. Bloom raised 2,500 million dollars of zero percent convertible notes due in 2030, with net proceeds of 2,440.2 million dollars, in November 2025, and it holds a 600 million dollar senior secured revolving facility dated December 2025. Cash was 2,666.9 million dollars at 30 June 2026, alongside customer advances of 445 million dollars at that date. Market capitalisation was about 65.3 billion dollars at 16 October 2026, and the score file notes a sharp weekly share-price fall of 21 percent in the week of 16 October during a sell-off in artificial intelligence infrastructure names. That volatility is recorded as a sensitivity to dilution and to sentiment, not as a change in the operating score, and the distinction is deliberate: the scoring model assesses the business, while the valuation note records that the market price has moved ahead of the business case. Hiring, scored 3 out of 5, is the least blitz-like element of the speed section. Headcount was 2,214 employees at 31 December 2025, up only 4 percent year on year, which is not blitz hiring. Revenue per employee on fiscal 2025 revenue was about 914 thousand dollars, a respectable figure for a manufacturer, and the score file credits the productivity implied by doubling revenue on a nearly flat headcount while remaining conservative on the hiring-speed item itself. Share of market momentum, scored 4 out of 5, rests on management's statement that every major United States hyperscaler plus more than twelve neocloud, artificial intelligence laboratory, and colocation operators have validated or approved Bloom's solution, and on cumulative deployments above 1.3 gigawatts. The score file withholds the fifth point because a quantified market share has not been confirmed, and that withholding is consistent with the treatment of backlog elsewhere: validation claims are recorded as management statements, not as measured shares.
Moat: manufacturing knowledge, delivery time, and a distribution inversion
The moat section, 37 out of 60, converts to 61.7 on a 100-point scale, and it is best understood as three different kinds of advantage that do not all pull in the same direction. The first is manufacturing knowledge. Bloom has spent twenty-five years developing solid oxide fuel cell manufacturing, and the score file pairs that history with a patent position and with two technical features that matter specifically for artificial intelligence workloads: readiness for 800-volt direct current, with all shipments in 2025 described as 800-volt direct current ready, and load-following capability for variable artificial intelligence workloads. The network effect subscore is only 7 out of 18, because Bloom has no classical network effect in which each additional user makes the product more valuable to every other user. The score file is explicit on this point, and it places Bloom alongside NBIS at the same subscore level: a supply-side and execution moat, in which speed of delivery functions as the moat, without the demand-side lock-in that a true network effect would provide. That honesty is important. A buyer that chooses Bloom for one data centre does not automatically make Bloom more valuable for the next buyer, except through the indirect channels of manufacturing scale, operating experience, and reputation. The moat is real, but it is a moat of execution rather than of compounding user value.
The second advantage is distribution, scored 10 out of 18, and it is the most original element of Bloom's strategy. The score file describes a structural inversion: utilities, which a conventional analysis would cast as competitors or gatekeepers, are converted into channels. The American Electric Power arrangement, described as up to one gigawatt, is the leading example, alongside the Brookfield artificial intelligence fund arrangement of up to five billion dollars, with a press-reported expansion to 25 billion dollars, in which Bloom holds a fifteen percent joint venture stake, and a 19 megawatt power purchase agreement financing arrangement with HPS and IDF. The score file applies a binding-versus-framework discount that is central to a fair reading of Bloom. Framework ceilings are not treated as orders. Binding contracts are limited, on the evidence cited, to American Electric Power at 100 megawatts, Oracle at an initial 1.2 gigawatts within an up-to-2.8 gigawatt arrangement, and HPS and IDF at 19 megawatts. Equinix is recorded at more than 100 megawatts across nineteen data centres. Everything above those binding figures is potential, and the distribution subscore is set two points below NBIS at 12, partly for that reason and partly because of customer concentration, discussed below. The lesson for readers is to ask, for every announced gigawatt, whether it is a ceiling, a framework, or a binding order with a delivery schedule, and to track the conversion from the first category to the third.
Market size, scored 10 out of 18, rests on the third-party research already described. Rystad Energy, cited through press reporting in 2026, puts the data centre fuel cell market at 2.8 billion dollars in 2025 rising to about 30 billion dollars in 2030, a tenfold increase, with cumulative fuel cell demand of 10.4 gigawatts between 2026 and 2030 and an outlook that about 40 percent of United States data centre capacity in 2030 will pursue dedicated on-site generation instead of grid power. North America is expected to account for 91 percent of global on-site generation installed capacity. The score file builds an estimated path from those figures, roughly 4.5 billion dollars in 2026, 7 billion in 2027, 11 billion in 2028, 17 billion in 2029, and 30 billion in 2030, cumulating to about 70 billion dollars for 2026 to 2030, and then, assuming growth slows to about 25 percent a year, a further roughly 309 billion dollars for 2031 to 2035, for a ten-year cumulative market of about 379 billion dollars. At an optimistic thirty percent share, justified in the score file by the press-reported description of Bloom as dominating the fuel cell market, together with twenty-five years of manufacturing knowledge, ninety-day deployment, and validation across hyperscalers, Bloom's ceiling would be about 114 billion dollars. The full twelve points are withheld until share is demonstrated quantitatively through framework-to-binding conversion, and that condition is the right one: a large market does not automatically confer a large share.
Gross margin, scored 10 out of 12, is the moat item that improved in the rescore, and it is the item the score file treats as a test of whether a blitz is genuine. The margin ramp reads as follows: gross margin of 14.8 percent in fiscal 2023, rising to 27.5 percent, then 29.0 percent in fiscal 2025, then 33.4 percent in the second quarter of 2026, and 33.8 percent in the third quarter of 2026, up 453 basis points year on year and up 40 basis points from the second quarter. Non-GAAP gross margin was 34.5 percent, consistent with fiscal guidance of about 34 percent. Product gross margin in the third quarter was 37.9 percent. Service gross margin improved from 11.6 percent in the third quarter of 2025 to 17.8 percent, an increase of 6.2 percentage points. GAAP operating margin moved from 17.1 percent to 18.2 percent, and non-GAAP operating profit was 285.7 million dollars, a margin of 23.1 percent. The score file's key-driver language calls this the textbook case in which margin direction separates a genuine acceleration from a merely subsidised one, and the third quarter extends the pattern rather than interrupting it: revenue more than doubled year on year while gross margin expanded. That combination is rare in hardware blitzes, where speed is usually bought with margin, and it is the single strongest rebuttal in the score file to the suspicion that Bloom is growing by discounting. It does not remove the backlog or concentration questions, but it does mean that the growth being questioned is, at least on the margin evidence, profitable growth at the gross line and increasingly profitable at the operating line.
Creative destruction: replacing the grid as the default
The creative destruction section, 9 out of 15, converts to 60.0 on a 100-point scale, and its three items describe different stages of the same substitution. The first item, the order being replaced, is scored 4 out of 5. The slogan in the score file is bring-your-own-power: on-site generation moving from a slogan for data centre developers to a business necessity, replacing the grid's position as the default source of power. The independent support cited is Rystad's outlook that about 40 percent of United States data centre capacity in 2030 will pursue dedicated on-site generation instead of grid power. The conversion of a utility into a channel, through the American Electric Power arrangement, is presented as a disruptive reorganisation of the existing order rather than a simple bypass of it: the incumbent is not merely displaced but repurposed. The fifth point is withheld because the substitution is still at an early stage, and that caution is warranted. Forty percent is a forecast for 2030, not a measured share today, and most power still arrives through the grid.
The second item, irreversible behaviour change, is scored 3 out of 5. The evidence is contractual and financial rather than cultural. Customer advances and deferred revenue rose from 445.0 million dollars to 754.4 million dollars in one quarter, and the score file cites a twenty-year power purchase agreement reported in the press between American Electric Power and Google for 702 megawatts in Wyoming, together with operations and maintenance service contracts of five to twenty years. Long contracts and prepaid cash create structures that are difficult to reverse quickly, and a developer that has built on-site generation into a facility's design, fuel supply, and operating model does not casually revert to waiting years for a grid connection. The score file again applies its framework discipline: many arrangements remain at the framework stage, so the binding scale has not yet been fully demonstrated, and the item is scored as in progress rather than complete. The third item, cost structure change, is scored 2 out of 5, the weakest of the three. Fuel flexibility across natural gas, biogas, and hydrogen is a genuine option value, and 800-volt direct current native design is cited with a company claim that it reduces non-compute capital expenditure for a one gigawatt artificial intelligence data centre by 27 percent. That figure is labelled as a company claim, and the score file records that measured evidence of a unit-cost collapse has not been publicly disclosed, hence the low score. The pattern across the three items is consistent: the direction of substitution is clear, the contractual lock-in is forming, and the cost proof is the least developed part of the case.
Deductions and risks: concentration, dilution, and an unresolved supply-chain dispute
Total deductions are 9 points, from debt at minus 4, revenue quality at minus 2, governance at zero, and regulatory and social cost at minus 3. Each deduction deserves separate treatment, because they are not the same kind of risk. Debt, scored minus 4 out of a possible minus 10, improved by one point in the rescore, and the improvement is mechanical and verifiable. Total debt was 2,476.4 million dollars at 30 September, comprising recourse debt of 2,473.5 million dollars and non-recourse debt of 3.0 million dollars, against total cash of 2,508.1 million dollars, producing net cash of about 31.7 million dollars. At the earlier as-of date the position had been net debt of about 164 million dollars, so the rescore records a crossing from net debt to net cash. Interest expense was 7.5 million dollars against interest income of 22.1 million dollars, a net interest income position. The real cost of Bloom's capital strategy, as the score file states plainly, is dilution rather than interest. Shares outstanding rose from 280.0 million at 31 December to 295.5 million at 30 September, an increase of 15.5 million shares, or 5.5 percent, through convertible note conversion, a slower pace than the 22.2 percent increase in share count during 2025 but still a material transfer of ownership. No additional convertible issue or equity raise was announced in the third quarter. The debt subscore therefore captures a company that has bought growth with equity rather than with interest-bearing leverage, and whose balance sheet, on the latest figures, no longer owes more than it holds in cash.
Revenue quality, scored minus 2, records an absence and a presence. There is no revenue restatement, auditor change, or audit opinion issue, and the fiscal 2025 10-K records no material litigation in the relevant item, with litigation arising after that filing. The presence is a securities class action filed on 31 July 2026 by Kirby McInerney, with a class period from 27 February 2025 to 8 July 2026, alleging failure to disclose dependence on China for scandium, with multiple law firms pursuing parallel actions and a lead plaintiff deadline of about 28 September 2026 now passed. The company denied the allegations in an 8-K, describing them as false and misleading. The score file labels the substance of the dispute as unconfirmed, and the deduction of two points reflects that uncertainty rather than a finding of wrongdoing. Governance, scored zero, records no trigger. Founder KR Sridhar holds 5.66 million shares, or 2.0 percent, and the officer and director group holds 8.34 million shares, or 3.0 percent, so founder control is low. Larger institutional holders are Ameriprise at 10.7 percent, BlackRock at 7.9 percent, and Vanguard at 6.9 percent. Class B shares are being cleaned up through a 2026 shareholder meeting agenda item, moving in the direction of resolving dual-class voting, and SK ecoplant's stake fell from 10.3 percent to 2.5 percent, ending its related-party status. None of that constitutes a governance deduction, but the low founder stake is worth noting alongside the concentration question: this is not a founder-controlled company in the classic blitzscaling sense.
Regulatory and social cost, scored minus 3, is where the unresolved dispute sits. On 8 July 2026, Hunterbrook published a report titled Bloom's Big Lie, making claims that the score file records as press-reported and unconfirmed: dependence on four Chinese routes for scandium, a requirement of 37 tonnes of scandium per gigawatt against global supply of about 240 tonnes a year, two-thirds of it from China, and the relevance of tightened Chinese export controls taking effect on 10 November 2026, after the scoring as-of date. The report also repeated two figures that the score file independently confirms from the 10-K: related-party revenue of 44 percent and the gap between the company-defined backlog of about 20 billion dollars and audited remaining performance obligations of 419.4 million dollars. The company responded in an 8-K on 9 July 2026 with a full denial, stating that it has no dependence on China and that it has supply visibility for 25 gigawatts a year. The score file does not adjudicate the dispute. It deducts three points because the export controls and the class action are real risks even while the underlying factual claims remain unconfirmed, and that treatment should be preserved in any summary: the risk is scored, the allegation is not endorsed. Separately, related-party revenue of 44 percent in fiscal 2025, or 892 million dollars through the Brookfield joint venture, up from 23 percent in fiscal 2024, is the single largest concentration fact in the file. The score file treats it as a distribution discount and as a monitoring variable rather than as a standalone deduction, but its significance should not be understated. A company in which one related-party relationship accounts for more than two-fifths of revenue, and in which the audited order book is about one forty-eighth of the headline backlog, depends unusually heavily on the conversion of frameworks into binding orders and on the durability of one partnership.
The valuation note, which is explicitly excluded from the score, completes the risk picture. Market capitalisation of about 65.3 billion dollars at 16 October 2026 already exceeded the G2 bar of about 40.5 billion dollars, with a price-to-sales ratio of about sixteen times fiscal 2026 estimated revenue on the earlier guidance basis and a price-to-earnings ratio of about 295 on a press-reported basis, together with year-to-date share appreciation of 154.7 percent to that date. The score file's own language is that price has moved ahead of the business, and that the business score does not look at price. That separation is a feature of the model, not an oversight, and it means that a reader who treats 58/C as a statement about market value will misread it. The score says the business is seven points short of the threshold for a high-conviction blitzscaling profile. The market, at the date cited, was pricing something considerably more optimistic than that profile. The 21 percent weekly fall in mid-October, during a sell-off in artificial intelligence infrastructure names, illustrates the sensitivity that follows from that gap, and the score file also records a high beta of 3.65 in that context. Volatility is not scored, but it is part of the environment in which the business must execute.
What to watch: conversion, concentration, and the scandium calendar
What to watch, for Bloom, reduces to a small number of observable conversions, each of which can be checked against a filing rather than a press release. The first is framework-to-binding conversion. American Electric Power is recorded as binding at 100 megawatts within an up-to-one-gigawatt arrangement, and Oracle as binding at an initial 1.2 gigawatts within an up-to-2.8 gigawatt arrangement. Additional binding orders from either relationship, or from the Equinix footprint of more than 100 megawatts across nineteen data centres, would strengthen the distribution subscore and narrow the gap between headline backlog and audited remaining performance obligations. A further quarter in which the company-defined backlog grows while audited remaining performance obligations and customer advances stand still would point in the opposite direction. The score file's proposed model improvement, a formal grading of backlog bindingness distinguishing frameworks, binding orders, and audited remaining performance obligations, is directly motivated by Bloom, and readers can apply that three-way distinction themselves to every future announcement before the model is changed.
The second watch item is concentration. Related-party revenue through the Brookfield joint venture rose from 23 percent to 44 percent of revenue in one year, and the joint venture structure, in which Bloom holds fifteen percent, means that the largest commercial relationship is also a related-party relationship. The relevant question for future quarters is not whether Brookfield remains important, which it plainly is, but whether the share stabilises or falls as other customers convert from validation to binding orders, and whether non-related-party revenue grows fast enough to dilute the concentration. A falling concentration ratio alongside continued record revenue would be a stronger signal than record revenue alone. The third watch item is margin durability. The third quarter extended the margin ramp to 33.8 percent gross margin, with product gross margin at 37.9 percent and service gross margin at 17.8 percent. If service margin continues to expand and product margin holds while volume doubles, the key-driver claim that margin direction validates the blitz will strengthen. If margin expansion stalls while product revenue growth decelerates, the score file's own logic would require a reassessment of the growth subscore, since that subscore currently rests on both volume and guidance momentum.
The fourth watch item is the scandium calendar, and it is the only one with a date that falls after the scoring as-of date. Tightened Chinese export controls are recorded as taking effect on 10 November 2026, and the class action filed on 31 July 2026 remains unresolved, with its factual allegations unconfirmed and denied by the company. What can be observed is not the truth of the Hunterbrook claims, which cannot be settled from the score file, but the company's disclosures: whether future filings address scandium sourcing, supply visibility, or inventory with the specificity that would allow an independent reader to test the 25 gigawatt annual supply visibility claim, and whether the litigation produces any development that changes the revenue-quality assessment. The fifth watch item is dilution and the balance sheet. The move to net cash of about 31.7 million dollars is a genuine improvement, but the share count rose 5.5 percent in nine months through conversion, after rising 22.2 percent in 2025. Future conversion activity, any new convertible issue, and the relationship between cash generation from operations and the need for external capital will determine whether the debt subscore improves further or reverses. Finally, the guidance path itself is a watch item: the fourth raise, to 4.4 to 4.6 billion dollars for fiscal 2026, sets a bar that fourth-quarter delivery must meet, and the next quarterly filing will show whether the five-quarter record run extends to six, and whether advances and deferred revenue continue to rise alongside reported revenue rather than diverging from it.
Bloom Energy at 58/C is, on this evidence, a company in the explosive first act of a blitz whose distribution innovation is genuinely structural, whose margins are expanding while it grows, and whose headline demand figures have not yet been converted into audited orders at anything like the scale the headlines suggest. The ninety-day deployment advantage over a five-to-seven-year grid connection is the clearest fact in the file, and it explains why hyperscalers, neocloud operators, utilities, and a large infrastructure investor have all engaged with the same supplier. The forty-four percent related-party share, the forty-eight-fold gap between headline backlog and audited remaining performance obligations, and the unresolved scandium dispute explain why the score stops at 58 rather than crossing 65. The rescore from 55 to 58 records real progress on growth, margin, and the balance sheet in a single quarter, and it also records, by its modest size, how much of the remaining gap is structural rather than quarterly: distribution proof, demand-side lock-in, and cost evidence are not items that move three points at a time. They move when frameworks become orders, when validation becomes repeat purchasing across many unaffiliated customers, and when a cost claim is demonstrated in measured unit economics. Those are the conversions to watch, and they are all checkable in the next filings.
More Power & Energy companies
Other Power & Energy names on the Blitz Index, highest score first: Solaris Energy Infrastructure (59/C), Forgent Power Solutions (50/C), Powell Industries (47/C).
Next earnings
Q4 2026 · Expected
Coverage
Bloom Energy Corporation · Q3 2026 earnings (Oct 22, 2026, AMC) · Score 58 · Grade C
Embed this score
Copy the HTML below to show this score on your site. The badge links back to this page and updates automatically when the score changes.
Preview:
BlitzLab scores businesses against a scholar’s standard — not investment advice. No price targets, no buy/sell recommendations. Figures are from SEC filings (XBRL) as labeled in the source scorecard.