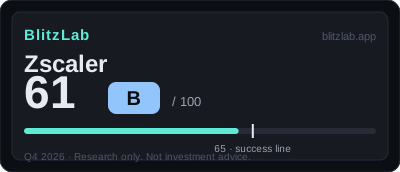
Zscaler — Blitz Index 61 (B)
ARR $3,771M (+25%) with a metering-based second curve — but the $10B ARR long-term goal is 30% of the G2 bar.
Last re-scored: October 17, 2026.
Confidence: High · Category: platforms
Score breakdown
| Section | Score | Detail |
|---|---|---|
| A · Speed | 18 / 25 | FY2026 revenue +25.4% ($3.35B); net-new ARR accelerating (+17% ex-Red Canary); FY2027 guidance slows to ~17% |
| B · Moat | 37 / 60 | 76.8% gross margin; 40%+ of Forbes Global 2000 as customers; channel-led distribution, no true network effects |
| C · Creative destruction | 11 / 15 | Firewall-and-VPN appliances → cloud-native Zero Trust Exchange; Zero Trust Everywhere 350 → 950+ in a year |
| D · BlitzFailing | −5 | SBC 24.5% of revenue drives GAAP losses; 2028 Notes $1,725M maturity wall; CRO transition |
Think we scored it wrong? Score it yourself →
Radar axes (0–100): Moat 61.7 · Speed 72 · Creative 73.3.
Watch item
Gates: G1 ✓ · G2 ✓ (borderline). 4 points below the threshold — first score. The business is a B; the price is the market's business.
Strengths
- ARR $3,771M (+25%) · RPO $7,365M (+27%) — subscription visibility
- Non-seat metering = 30% of new/upsell ACV (ARR +100% YoY) + Z-Flex TCV $1.7B — the usage-economy second curve
- Security for AI bookings $100M+ (+50% QoQ) — the adjacent-market entry with real numbers
- Non-GAAP operating margin 23% (record) + $779M FCF — a cash-generating SaaS
Concerns
- FY2027 guidance +17% vs FY2026 +25% — temporary slowdown or structural, decided at Q1 FY2027
- $10B ARR long-term goal is 30% of the G2 bar — the self-drawn ceiling is the structural debate
- SBC/revenue 24.5% ($822M) — the identity of GAAP losses, structural dilution
- 2028 Notes $1,725M maturity concentration (conversion $439.52 = 2.1x current price); CRO changeover
Research notes
Thesis: a mature security platform trying to grow past the seat
Zscaler is best understood as a company in the second act of a story that began well before this scoring date. Co-founded by Jay Chaudhry in 2007 and taken public in 2018, the company built its first act around a cloud-native Zero Trust Exchange, an alternative to the firewall and virtual private network appliances that once defined enterprise network security. By fiscal 2026, that first act had reached a substantial scale: revenue of $3,352.5 million, up 25.4% year on year, and annual recurring revenue of $3,771 million, up 25%, both confirmed in the company's fiscal 2026 Form 10-K. The question this score tries to answer is not whether that first act worked. It plainly did. The question is whether a second act — growth that no longer depends mainly on adding more user seats — can carry the company forward at a comparable pace, and whether the market available to that second act is large enough to justify the ambition implied by a blitzscaling assessment.
On the evidence available at the scoring date of 17 October 2026, Zscaler earns 61 out of 100, grade B, four points short of the 65-point threshold used on this site. The composition matters as much as the total. Speed contributes 18 of 25 points, creative destruction contributes 11 of 15, and moat contributes 37 of 60, while deductions take away 5 points. In the radar terms used for this model, that translates to 72.0 for speed, 73.3 for creative destruction, and 61.7 for moat. The shape of the score therefore describes a company whose disruption of an old order and whose operating pace look stronger than the durability of its competitive advantage. That is a common profile for a mature software-as-a-service business: the product has already changed how customers work, the engine still runs fast, but the moat is built more from switching costs and distribution than from a self-reinforcing network effect, and the deductions, though modest, point to structural costs that do not disappear quickly.
The score is a first scoring for Zscaler, made without a blind review, and it rests on the fiscal 2026 Form 10-K filed on 3 September 2026 for the year ended 31 July 2026, together with the fourth-quarter fiscal 2026 Form 8-K. Fiscal 2027 first-quarter results had not been published before the scoring date and are excluded. That timing matters for everything that follows, because several of the most important judgements — the pace of the second growth curve, the effect of a change in sales leadership, and whether slower guidance is a pause or a new trajectory — can only be tested against results that had not yet arrived. The draft below therefore treats guidance and reported momentum as distinct things: guidance is what the company said it expected, and momentum is what its filed results and reported operating indicators showed up to the scoring date.
The score at a glance
The item scores are as follows. For speed: growth 8 of 10, capital velocity 3 of 5, hiring and productivity 3 of 5, and share velocity 4 of 5, for a subtotal of 18. For moat: network effects 8 of 18, distribution scalability 10 of 18, market size 9 of 12, and gross margin 10 of 12, for a subtotal of 37. For creative destruction: the order being replaced 4 of 5, irreversible behaviour change 4 of 5, and cost-structure change 3 of 5, for a subtotal of 11. Deductions are debt minus 3 of a possible minus 10, revenue quality 0, governance minus 1 of a possible minus 5, and regulatory and social cost minus 1 of a possible minus 5, for a total deduction of minus 5. Adding those parts gives 18 plus 37 plus 11 minus 5, which equals 61, grade B. There is no FLAG on this score, because the deduction total of 5 is well below the 15-point FLAG threshold. The company passes both gates, although the second gate passes only on a borderline judgement that deserves to be explained in full rather than glossed over.
Speed: still fast at scale, but the next year is guided slower
The growth record in the score file is a story of deceleration followed by a modest re-acceleration, and that shape is central to the growth score of 8 rather than a higher mark. Revenue rose from $1,090.9 million in fiscal 2022, up 62.1%, to $1,617.0 million in fiscal 2023, up 48.2%, to $2,167.8 million in fiscal 2024, up 34.1%, to $2,673.1 million in fiscal 2025, up 23.3%, and then to $3,352.5 million in fiscal 2026, up 25.4%. Sustaining growth in the mid-twenty percent range at a revenue base above $3 billion is the reason the score remains high, but the history also shows why it is not higher: the company is no longer compounding at the rates of its earlier years, and its own guidance for fiscal 2027 points to growth of 16.6% to 17.5%, with first-quarter fiscal 2027 guidance of $935 million to $939 million, up about 19% year on year. A reader should therefore keep two facts together. The filed fiscal 2026 result was a re-acceleration from fiscal 2025, and the guided fiscal 2027 result would be a deceleration from fiscal 2026. Whether the second fact is temporary or structural was, at the scoring date, an open question to be settled by the first-quarter fiscal 2027 results expected in late November to early December 2026.
Two forward-looking indicators in the filed results support the case that demand had not yet run out of room. Remaining performance obligations reached $7,365.4 million, up 27.4%, which gives the company a large contracted backlog relative to its annual revenue and makes near-term revenue more visible than it would be for a business contracting mainly on short terms. Net new annual recurring revenue was $246 million, up 24%, and, on a basis that excludes the Red Canary acquisition, the growth rate of net new annual recurring revenue accelerated across the year, from 7% in fiscal 2025 to 10% in the first half of fiscal 2026 and 17% in the fourth quarter, on a press-reported earnings-call basis. That acceleration is one of the strongest pieces of evidence in the score file for the gate judgement that growth can continue or that a second growth curve is emerging. At the same time, the score withholds a higher growth mark for a disclosure reason that should not be overlooked: from fiscal 2026 the company stopped disclosing dollar-based net retention and calculated billings as it moved to an annual recurring revenue framework, so retention can no longer be tracked in the way it previously could be. The score records that loss of visibility as a reason to withhold a point, and it records the discontinued disclosure as a concern even though it does not deduct points for it under revenue quality.
Capital velocity scores 3 of 5, reflecting a balance sheet that is strong but not unconstrained. The company held liquidity of $3,474.2 million against convertible notes carried at $1,696.4 million, leaving net cash of positive $1,778 million on a confirmed basis. Its only borrowing was the 0.0% notes due in 2028, with a principal amount of $1,725 million, a conversion price of $439.52, described in the score file as about 2.1 times the share price at the scoring date, and a maturity concentrated in July 2028. The absence of interest cost is a genuine advantage, but the concentration of the maturity and the distance of the conversion price from the share price mean that the notes cannot simply be assumed to convert. The score also notes, on a press-reported basis, that the share price had fallen 7.8% year to date and 30.9% over one year from its fifty-two-week high, which weakens the equity financing window even though access to capital markets is described as sound, and it notes that the company paid no dividend and made no share repurchases. Hiring and productivity also score 3 of 5. The company employed more than 8,700 people, with 60% outside the United States, implying revenue per employee of approximately $385,000, and fourth-quarter sales productivity was reported on an earnings-call basis as the best quarter on record, with the full year the best in four years. Against that, a change of chief revenue officer, effective 1 October 2026, introduces a leadership transition at exactly the moment when the sales organisation must prove that the second growth curve is real.
Share velocity scores 4 of 5, held back only by the absence of a quantified market share figure. The customer base numbered about 11,000, including more than 40% of the Forbes Global 2000, both confirmed in the Form 10-K. Customers with annual recurring revenue above $1 million numbered 785, up 18% year on year, and customers above $10 million almost doubled year on year. The Zero Trust Everywhere programme, which is discussed further below, grew from 350 customers to more than 950 within a year. Those are the marks of a land-and-expand motion that is still working: the company is not only adding logos but also deepening its position inside large customers. What the score cannot confirm is the share of the total market that position represents, and the score is explicit that a full mark is withheld until a quantified share is available.
Moat: switching costs and distribution, not a classic network effect
The moat section is where Zscaler's score is most distinctive, and also where a casual reader is most likely to misunderstand it. Network effects score only 8 of 18, and the score file is unusually direct about why: on a structural judgement, the company does not have a true network effect. What it has instead is a form of operational lock-in created by the act of moving to a Zero Trust architecture. Once an enterprise has rebuilt its network security around Zscaler's cloud-native exchange, removed agents, and hidden its network attack surface, reversing that architecture is difficult and disruptive. That is a real switching cost, and it helps explain retention and expansion, but it is not the same as a product that becomes more valuable to each customer because other customers use it. The score therefore places Zscaler in the upper part of the anchor range for data and ecosystem effects that exist but are weak, and it credits supporting evidence rather than pretending the effect is something it is not.
That supporting evidence is worth setting out, because it is also the evidence for the second growth curve. About 70% of Security for AI transactions included data security, on an earnings-call reported basis, which suggests that customers adopting the newer artificial intelligence security offering are also adopting adjacent protection rather than a single point product. Customers adopting Z-Flex, the consumption-based licensing model, showed an average annual recurring revenue uplift of about 30%, with total contract value above $1.7 billion in fiscal 2026. Metering-based offerings that are not tied to user seats accounted for about 30% of new and upsell annual contract value, and the annual recurring revenue associated with those offerings grew 100% year on year. Taken together, those figures describe a multi-product penetration story: the platform is supplying more kinds of protection into the same customer, and the pricing model is shifting from counting seats to metering usage. That shift is commercially important, because a seat-based model is ultimately bounded by headcount, whereas a usage-based model can grow with data, traffic, and artificial intelligence workloads. It is also, however, a newer and less proven engine than the seat-based business that built the company, and the score reflects that balance.
Distribution scalability scores 10 of 18, on a deliberately conservative judgement. Sales are centred on channel partners, and the Form 10-K's risk factors explicitly state a dependence on expanding channel relationships. The land-and-expand evidence cited above — Zero Trust Everywhere growing from 350 to more than 950 customers, 785 customers above $1 million in annual recurring revenue, and Z-Flex contract value above $1.7 billion — shows that the channel-led model can repeat and expand. About 47% of revenue came from outside the United States, which shows that the model travels. What is missing is any viral element: customers do not adopt Zscaler because other customers adopt it in the way users join a consumer network. The score file places the company between the anchor for paid, sales-dependent distribution that can still expand repeatedly and the anchor for strong distribution partners, and it applies the conservative principle by awarding 10 rather than the higher anchor. A reader should understand that choice as a statement about the model, not as a criticism of execution: enterprise security is distributed through sales channels, not spread virally, and the score gives credit for a sales machine that demonstrably expands while refusing to credit a mechanism that does not exist.
Market size scores 9 of 12, and this is where the second gate judgement and the moat judgement meet. The gate requires that the ten-year market ceiling be at least ten times current revenue, which for fiscal 2026 revenue of $3,352.5 million implies a bar of about $33.5 billion. The company's own long-term target, announced at its Investor Day on 6 October 2026 and confirmed in a Form 8-K, is $10 billion in annual recurring revenue — only about 30% of that bar. The score file records, plainly, that the company's own target does not pass its own gate. The gate is nevertheless passed on a borderline basis by adding third-party market estimates and adjacent markets. A MarketsandMarkets estimate, reported in June 2025, puts the secure access service edge market at $15.52 billion in 2025 rising to $44.68 billion in 2030, a compound annual growth rate of 23.6%, which is only about 1.3 times the bar. A Dell'Oro estimate reported in November 2025 puts the same market at $24 billion in 2030, below the bar. Only by adding adjacent markets — data security, security operations, and artificial intelligence security — does the ceiling reach the bar, and the score file is explicit that those adjacent markets are the justification, citing Security for AI bookings above $100 million and the Agentic SecOps offering launched in September 2026 in combination with Red Canary as evidence of entry into them. The score also notes that the company itself presented no total addressable market figure in either the Form 10-K or the Investor Day materials, so the entire market case depends on third-party estimates, which are labelled as estimates in this draft. A full mark is reserved for a future point at which the adjacent markets are evidenced with quantified totals of their own.
Gross margin scores 10 of 12 and is the strongest moat item. The fiscal 2026 gross margin was 76.8%, confirmed in the Form 10-K, within a stable range of about 77% to 78% from fiscal 2022 to fiscal 2026, with a non-GAAP gross margin of about 80%. Operating cash flow was $1,129.7 million, or 34% of revenue, and free cash flow was $779.1 million, a margin of 23.2%, both confirmed. The sum of revenue growth and free cash flow margin gives a Rule of 40 figure of 48, which the score file cites as evidence of a cash-generating software business rather than a business funding growth with losses. Two qualifications belong in the same paragraph. Fourth-quarter free cash flow fell sharply to $60.8 million because capital expenditure surged, driven by memory prices, to $218.5 million, and the score treats normalisation as a premise resting on fiscal 2027 capital expenditure guidance in the low teens as a percentage of revenue, not as a fact already observed. And the generally accepted accounting principles operating loss of minus 4% is driven by stock-based compensation, a point that returns in the deductions section. Neither qualification overturns the margin story, but both prevent it from being told as an unqualified success.
Creative destruction: replacing appliances with an architecture customers cannot easily undo
Creative destruction scores 11 of 15, and its three items describe a coherent replacement story. The order being replaced scores 4 of 5. The legacy order is network security appliances — firewalls and virtual private networks — and the replacement is the cloud-native Zero Trust Exchange. The scale of the replacement is already demonstrated by annual recurring revenue of $3,771 million, up 25%, and the target being replaced is clear and large. The score withholds the top mark because penetration, measured against total worldwide network security spending, is still below a majority, so the replacement is advanced but not complete. That is a useful discipline: it prevents a large revenue figure from being mistaken for a finished revolution.
Irreversible behaviour change also scores 4 of 5, and here the Zero Trust Everywhere figure does much of the work. Growth from 350 to more than 950 customers within a year, on an earnings-call reported basis, is not merely a sales statistic; it represents enterprises that have removed agents and hidden their network attack surface, an architectural change that is difficult to reverse without rebuilding the security model. The contracted visibility provided by remaining performance obligations of $7,365.4 million, up 27.4%, reinforces the point, because customers have committed to that architecture over time rather than merely trialling it. The launch in September 2026 of Agentic SecOps, combining Zscaler's platform with Red Canary, extends the same logic into the artificial intelligence era: as autonomous agents become part of enterprise workflows, the security model must govern machine actors as well as human users, and a platform already positioned as the exchange through which traffic passes has a plausible claim to that new axis. The score treats that claim as a new axis rather than a proven one, which is why the mark is 4 and not 5.
Cost-structure change scores 3 of 5, the weakest of the three creative destruction items, and the reason is a gap between a pricing change and a cost proof. Z-Flex, the consumption-based licensing model, is credited with driving upsell, with adopting customers showing an average annual recurring revenue uplift of about 30% and contract value above $1.7 billion, on a reported basis. Non-GAAP operating margin reached 23%, described in the score file as a record high. What the company has not publicly disclosed, according to the score file, is a measured figure for the collapse in unit security cost, such as cost per user, that would demonstrate a structural change in the economics of security rather than a change in how it is charged for. The score therefore credits the commercial effect of the pricing transition while withholding credit for an unproven cost transformation. That distinction is worth preserving in any retelling of this story: charging differently is not the same as costing differently, and the score is careful not to conflate the two.
Deductions and risks: a clean audit, a heavy stock-compensation bill, and a concentrated maturity
Deductions total only minus 5, which is why there is no FLAG, but the composition of those five points is more informative than the total. Debt scores minus 3 of a possible minus 10. The 2028 notes of $1,725 million, at 0.0% interest and maturing on 15 July 2028, carry no interest burden, and liquidity of $3,474 million could cover a cash repayment if the notes do not convert. Total debt is 1.6 times revenue, and net cash is positive $1,778 million. The deduction is driven less by the notes themselves than by stock-based compensation of $821.9 million, or 24.5% of revenue. That proportion has stabilised from 37.5% in fiscal 2022, which is genuine progress, but the absolute amount remains a structural dilution cost: the business pays for talent in equity, and shareholders bear that cost even when the income statement is read on a non-GAAP basis that excludes it. The score file explicitly compares this with a lighter deduction for a peer at a lower stock-compensation ratio, and the message is that the deduction is calibrated, not punitive. A company can improve this item over time only by reducing the ratio further or by demonstrating that the dilution is matched by per-share value creation, and neither is yet established.
Revenue quality scores 0, which is the cleanest item in the deductions section. The score file records no accounting restatement, no change of auditor, and no audit opinion issue. The auditor is PricewaterhouseCoopers, internal controls were found effective, with the exception that four fiscal 2026 acquisitions were excluded from that evaluation, and the business is centred on subscription revenue with its annual recurring revenue definition disclosed. The discontinued disclosure of dollar-based net retention and calculated billings is recorded as a concern but is not deducted under this item, a choice that keeps the accounting judgement separate from the transparency judgement. Readers should not read a zero here as a statement that everything about disclosure is ideal; they should read it as a statement that the filed accounts themselves gave no trigger for a deduction.
Governance scores minus 1 of a possible minus 5, and the balance of that item favours the company. There is no dual-class share structure: the company has had a single class of common stock since its initial public offering document, which is a relative strength in a market where founder control is often entrenched through supervoting shares. Founder Jay Chaudhry held about 16.8% on a one-share, one-vote basis, with family trusts owning about 18.2%. Against that strength, the Form 10-K's risk factors state that the company depends heavily on Chaudhry, which is a key-person risk, and the score also notes a chief revenue officer transition and a shareholder proposal for board declassification that the board recommended against. The net deduction of one point is therefore a small charge for concentration of human dependence and for a governance friction, set against a structurally clean capital structure. It is not a judgement about the founder's quality; it is a judgement about dependence.
Regulatory and social cost also scores minus 1 of a possible minus 5. The Form 10-K records no material pending litigation. The company has obtained Federal Risk and Authorization Management Program Moderate and High authorisations and Department of Defense Impact Level 5 certification, which are prerequisites for serving government customers, and the Form 10-K notes the risk that failure to maintain those certifications would affect that business. Competition is named on an industry-reported basis as Palo Alto Networks with Prisma SASE, Netskope, Cloudflare One, and Fortinet, with the score file noting that the Form 10-K itself does not name competitors. The score also records a history of guidance becoming more conservative after sales leadership departures, which connects this item back to the chief revenue officer transition: the risk is not only that a new sales leader must learn the organisation, but that the organisation has previously responded to such transitions by guiding more cautiously. That history does not prove that fiscal 2027 guidance is excessively cautious, but it does mean that guidance alone cannot be read as a pure forecast of demand.
What to watch: the second curve, the ceiling, and the 2028 maturity
Three questions will decide whether Zscaler's next scoring moves toward the 65-point threshold or away from it, and all three are already visible in this score file. The first is whether the second growth curve accelerates fast enough to offset deceleration in the first. The evidence to track is the metering-based share of new and upsell annual contract value, currently about 30%, the growth of the annual recurring revenue associated with those offerings, currently 100% year on year, and Security for AI bookings, currently above $100 million with fourth-quarter growth of 50% quarter on quarter on a reported basis. If those engines grow while seat-based growth slows, the thesis of a second act stands. If they stall, the fiscal 2027 guidance deceleration of 16.6% to 17.5% will look less like a transition and more like the new pace. The first-quarter fiscal 2027 results, expected in late November to early December 2026, are the first test, and the score file is explicit that they were excluded from this scoring because they had not yet been published.
The second question is the ceiling. The company's own long-term target of $10 billion in annual recurring revenue is, on the score file's arithmetic, only 30% of the $33.5 billion bar implied by the gate. That gap is not a criticism of the target itself — $10 billion would be nearly three times fiscal 2026 revenue — but it frames the strategic challenge. To pass the gate on a comfortable rather than a borderline basis, Zscaler must demonstrate that adjacent markets in data security, security operations, and artificial intelligence security are not merely adjacent in a presentation but quantified, entered, and growing at scale. The Agentic SecOps launch in September 2026 and the Red Canary combination are the first evidence offered for that entry, and the Red Canary acquisition itself, at $651.4 million in cash as described in the blitzscaling fit section, shows that the company is willing to fund that entry from its own cash generation rather than from borrowing. Whether that entry produces a market large enough to change the gate arithmetic is a multi-year question, and it is the single largest structural uncertainty in the score.
The third question is execution through transition. A chief revenue officer who took office on 1 October 2026 must lead a sales organisation whose fourth-quarter productivity was reported as a record, while guiding a year that is already guided slower than the year just finished. The score file's history of more conservative guidance after sales leadership departures means that observers should separate the act of guiding cautiously from the underlying demand signal, and should look instead at net new annual recurring revenue, remaining performance obligations, and the expansion figures for large customers. Alongside that, two balance-sheet and cost items deserve routine attention: the 2028 notes, whose conversion price of $439.52 stands at about 2.1 times the share price at the scoring date and whose July 2028 maturity will require either conversion or cash repayment, and stock-based compensation at 24.5% of revenue, whose decline from 37.5% in fiscal 2022 shows direction but whose absolute level still drives the gap between a record non-GAAP operating margin of 23% and a generally accepted accounting principles operating loss of minus 4%.
In summary, Zscaler at 61/B is a mature, cash-generating security platform whose first act — replacing appliance-based network security with a cloud-native Zero Trust architecture — is substantially proven, whose second act — usage-based pricing and artificial intelligence security — is genuinely under way but not yet proven at scale, and whose market ceiling, on the company's own target, remains lower than the bar this model sets. That combination explains both the grade and the distance from the threshold: the business earns high marks for speed and for creative destruction, a middling mark for a moat built on switching costs rather than network effects, and a modest deduction for the structural costs of paying for talent in equity and carrying a concentrated maturity. The next chapter will be written less by the size of the first act than by the speed at which the second act grows, and by whether the adjacent markets it enters turn out to be large enough to raise the ceiling the company has set for itself.
Head-to-head
Zscaler vs Cloudflare — side-by-side scorecard comparison.
More Platforms companies
Other Platforms names on the Blitz Index, highest score first: Alphabet (83/A), Meta (78/B), Airbnb (76/B).
Next earnings
Dec 2, 2026 · After close · Confirmed
Coverage
Zscaler, Inc. · Q1 FY2027 due Nov 24, 2026 (expected) · Score 61 · Grade B
Embed this score
Copy the HTML below to show this score on your site. The badge links back to this page and updates automatically when the score changes.
Preview:
BlitzLab scores businesses against a scholar’s standard — not investment advice. No price targets, no buy/sell recommendations. Figures are from SEC filings (XBRL) as labeled in the source scorecard.