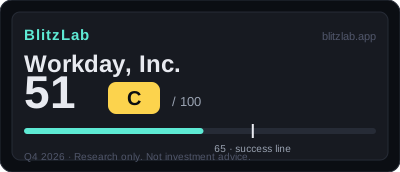
Workday, Inc. — Blitz Index 51 (C)
Workday scores 51 — the lowest of the mature SaaS four, not because it is deteriorating but because its AI second curve is still narrative, not numbers.
Last re-scored: October 21, 2026.
Confidence: High · Category: platforms
Score breakdown
| Section | Score | Detail |
|---|---|---|
| A · Speed | 12 / 25 | FY2026 +13.1% to $9,552M — the highest growth rate among mature SaaS peers, yet A2 · A3 stall on capital burn and productivity evidence |
| B · Moat | 33 / 60 | Fortune 500 penetration at 65% gives installed-base gravity, but TAM $276B is a company claim and AI ARR ~$600M is only ~7% of subscriptions |
| C · Creative destruction | 9 / 15 | AI agents: 5,500+ customers and 25%+ of new ACV — real, but at the same stage as CRM's Agentforce: undisclosed inside the subscription mix |
| D · BlitzFailing | −3 | Class B dual-class majority control (−2) and the 2025 CRM-system social-engineering breach (−1) |
Think we scored it wrong? Score it yourself →
Radar axes (0–100): Moat 55.0 · Speed 48 · Creative 60.
Watch item
Gates: G1 ✓ · G2 ✓ (borderline — bar ≈ $95.5B (FY26 revenue × 10) is ~86% of the third-party HCM 10-year ceiling; only with financial SaaS + AI included does it clear).
Strengths
- $10B scale with subscriptions +14.4% · cRPO +14.2% (faster than backlog) · FY27 guide raised — the growth trajectory is top among mature SaaS
- First numbers on the AI second curve: 25%+ of new ACV · 5,500+ agent customers (+35% QoQ) — evidence for G1's second curve
- GRR ~97% + existing-customer expansion ≈ 60% of subscription growth — quantified land-and-expand
- Non-GAAP operating margin 29.6% (Q2 31.1%) · FCF $2,777M (+27%) — the dual signature of margin and cash generation
- 65% Fortune 500 penetration + 75M+ contracted users — the scale of installed-base gravity
Concerns
- Confirmed deceleration trajectory (+16.4% → +13.1%, quarter +13.9%) — no disclosed evidence of re-acceleration
- TAM $276B is a company claim (press-reported) — with third-party HCM estimates alone, the bar ($95.5B) sits at ~86% of the 10-year ceiling
- Class B majority vote control (founders) — confirmed concentration of dual-class power
- Cash −58% in one year ($8,017M → $3,403M) — the burn rate of $2.2B acquisitions + $2.9B buybacks
- SBC $1,626M (17% of revenue) — the largest driver of the 22pp GAAP↔non-GAAP gap, still rising in absolute terms
- Seat-pricing → agent-pricing transition risks self-cannibalization of the core business (Flex Credits)
Research notes
Thesis: the weakest of four mature names, and not the weakest business
Workday's score of 51 out of 100, grade C, is best read first as a ranking and only second as a verdict on the company itself. The score file places Workday lowest among four mature software-as-a-service names scored in the same programme: Salesforce (CRM) at 65/B, ServiceNow (NOW) at 63/B, Adobe (ADBE) at 61/B, and Workday at 51/C. The arithmetic behind that ranking is exact and worth stating plainly before any interpretation: speed 12 out of 25, moat 33 out of 60, creative destruction 9 out of 15, and deductions of 3 points, giving 12 plus 33 plus 9 minus 3 equals 51. That total sits 14 points below the 65-point line BlitzLab uses as its threshold, and there is no FLAG marker, because deductions of 3 points fall well short of the 15-point FLAG threshold. On the radar conversion used in the score file, the three sections translate to moat 55.0, speed 48.0, and creative destruction 60.0 out of 100. The shape of those three numbers already tells much of the story: the creative-destruction section is the strongest in percentage terms, the moat is middling, and speed is the weakest, which is an unusual profile for a company whose growth rate, taken alone, is actually higher than that of the highest-ranked name in the group.
That tension is the score file's own first key driver, and it is the right frame for this body. Workday is, in the score file's phrase, not a company that has become bad but a company whose evidence is weaker. Its fiscal 2026 revenue growth of 13.1% exceeds Salesforce's 10.8% in the comparable period cited in the file, yet Workday scores lower overall. The gap, the score file explains, comes roughly half from three places: the market-size item, where the total addressable market of $276 billion rests on a company presentation carried through press reporting rather than on a directly disclosed filing figure; the network-effect item, where the quantitative evidence is thinner than ServiceNow's; and the two deduction items that do fire, dual-class governance and a realised security incident. None of those is a claim that the underlying business has deteriorated. All of them are claims about what the public record, as of the scoring date, can and cannot support at the standard the frozen BlitzLab v1.0 model demands.
The scoring context matters for reading everything that follows. This is a first scoring, not a rescore, and there was no blind process applied. The as-of date, T, is October 20, 2026, and the date scored is October 21, 2026. Workday's fiscal year ends in January, so the latest results available at T were fiscal 2027 second-quarter results, announced on August 27, 2026. Fiscal 2027 third-quarter results, for the quarter ending October 31, 2026, fall after T and are therefore excluded from the score; they appear in this body only as a future marker, with no anticipated outcome attached. The score file's confidence is recorded as high, based on direct review of the original texts of the fiscal 2026 Form 10-K, the fiscal 2027 second-quarter Form 10-Q, and the August 27, 2026 Form 8-K exhibit 99.1 on SEC EDGAR, cross-checked against XBRL company facts, with some items resting on press reporting. Where this body relies on a press-reported figure, it says so. Where the score file marks a figure as estimated or unconfirmed, this body preserves that label rather than smoothing it into a fact.
Both gates pass, and the character of the second pass is essential to the whole score. Gate 1, which asks whether growth continues or a second growth curve exists, passes on a mixture of confirmed and press-reported evidence: double-digit growth at a scale above $10 billion in trailing-twelve-month revenue, a raised subscription guidance range for fiscal 2027, and the first quantified signs of a second curve in artificial intelligence and agents, discussed in detail below. Gate 2, which asks whether the ten-year ceiling of the new market is at least ten times current revenue, passes only as a borderline case, and the score file labels it explicitly as borderline, an observation item rather than a comfortable pass. This body keeps that label exactly as given. It does not upgrade the gate, because the upgrade would require evidence the score file says is not in the public record. The borderline character of Gate 2 is not a footnote to the score. It is, through the market-size item, one of the main reasons the total is 51 rather than higher, and it recurs in every section where the company's own market claim meets independent market estimates.
What Workday is, in the score file's classification, is a mature company: trailing-twelve-month revenue of approximately $10.2 billion, fiscal 2026 revenue of $9,552 million. The blitzscaling question for a company at that stage is different from the question for a young company. It is no longer whether the original blitz succeeded. The migration of human capital management and finance software from on-premise systems to a cloud platform is, for Workday, a completed first blitz; the score file calls the company a graduate of its original blitz, now in a waiting interval before a possible second one. The question is whether a second curve, built on AI agents, can be demonstrated in numbers rather than asserted in narrative, and whether the economics of that transition strengthen or dilute the position the first blitz built. On the evidence available at T, the answer is genuinely in progress. The numbers for the agent curve exist, they are growing fast from a small base, and they are still small relative to the subscription base they are supposed to transform. That is the central tension of this scorecard, and the sections that follow unpack it item by item.
Speed: double-digit growth at $10 billion scale, bought with shrinking headcount and shrinking cash
Speed scores 12 out of 25, the weakest section in percentage terms at 48.0 on the radar conversion, and its four items pull in different directions. Growth scores 5 out of 10, capital velocity 2 out of 5, hiring and productivity 1 out of 5, and share velocity 4 out of 5. The section total is therefore not a story of a company that has stopped growing. It is a story of a company growing steadily at large scale while scoring poorly on the two items that measure how that growth is financed and staffed, and scoring well only on the item that measures a market position already won.
Growth, at 5 out of 10, rests on confirmed figures of a kind that leave little room for argument about direction. Fiscal 2026 total revenue was $9,552 million, up 13.1% year over year, and subscription revenue was $8,833 million, up 14.4%. In the second quarter of fiscal 2027, total revenue was $2,649 million, up 12.8%, and subscription revenue was $2,471 million, up 13.9%. Current remaining performance obligations, or cRPO, stood at $9,034 million, up 14.2% year over year, which is faster than total backlog growth of 8.0%, a detail the score file singles out because it means the near-term demand signal is running ahead of the headline revenue growth rate. Fiscal 2027 subscription guidance of $9.94 billion to $9.95 billion, up 13% and raised from an earlier level, points in the same direction. The score file is equally explicit about what holds the growth score at 5 rather than higher: the deceleration trajectory, from 16.4% growth to 13.1%, is confirmed, and there is no disclosed evidence of re-acceleration. Double-digit growth at a scale above $10 billion is, in the score file's judgement, evidence of sustained growth sufficient to pass Gate 1, but it is not the kind of growth that earns a top growth score. The comparison embedded in the score file makes the calibration visible. Adobe also scores 5 on growth, on growth of 12.9% at a trailing-twelve-month scale of $26 billion, and the file judges Workday slightly ahead of Adobe on both growth rate and scale; ServiceNow scores 6 on growth of 24%. The scale of the judgement is therefore consistent: Workday's growth is respectable at its size, it is faster than Salesforce's, and it is a long way from the pace that would mark a company still in its blitz phase.
Capital velocity scores 2 out of 5, and the evidence here is a study in contrasts that the score file does not resolve into a single cheerful narrative. On one side, the company is deploying capital at a pace that shows access and intent. In fiscal 2026 it repurchased approximately 12.8 million shares for $2.9 billion, and in the second quarter of fiscal 2027 it repurchased a further $1.3 billion of shares alongside a new $4 billion open-ended repurchase programme announced on August 27, 2026. It acquired Paradox and Sana for $1.1 billion each, a combined $2.2 billion spent on buying AI capability rather than building it entirely in-house. Free cash flow of $2,777 million, up 27% year over year, at a margin of 29.1%, is excellent by any standard, and shows that the business generates the cash it is deploying. An investment of more than $2 billion by Elliott, the activist investor, described in the score file as supportive in character, is recorded as a signal of capital access, though the file is careful to say it does not rise to the level of lifting the velocity score.
On the other side, two facts pull the score down, and both are confirmed. The first is the market-capitalisation doubling test that the model uses as a speed marker: the cover price of the Form 10-K was $229.38 as of July 31, 2025, and the press-reported price was $184.26 as of October 7, 2026, so the test is not met; the share price fell over that interval rather than doubling. The second is the pace at which the cash pile itself is shrinking. Cash plus marketable securities fell from $8,017 million to $3,403 million in one year, a decline of 58%, driven by the $2.2 billion of acquisitions and the $2.9 billion of repurchases. That is not a liquidity crisis, and the score file does not present it as one; the debt item, discussed below, does not fire. It is a statement about direction: the company's financial flexibility is narrowing at the same time as it is spending heavily on buybacks and acquisitions, and the capital scale remains below Salesforce's, whose repurchases of $12.6 billion and free cash flow of $14.4 billion are cited in the score file as the reason Salesforce scores 3 on this item against Workday's 2. Workday is placed at the same level as ServiceNow and Adobe, at 2. The judgement is therefore comparative as well as absolute: capital is being deployed fast, but the deployment is consuming the balance sheet faster than the business is replenishing it, and the market has not rewarded the deployment with a rising share price over the test window.
Hiring and productivity scores 1 out of 5, the lowest item score in the business sections, and the reason is structural rather than a single bad quarter. Revenue per employee in fiscal 2026 was approximately $453,000 on the score file's calculation, which falls short of the model's $1 million benchmark, and sits below both Salesforce at approximately $527,000, scoring 2, and ServiceNow at approximately $508,000, scoring 1. More important than the level is the trajectory of headcount itself. The score file records three consecutive restructuring plans: a fiscal 2026 plan reducing headcount by 7.5% at a cost of $303 million, a fiscal 2027 plan reducing headcount by a further 2%, and an additional reduction of approximately 2.5%, around 500 people, announced in September 2026 at a cost of $65 million to $85 million, centred on product and technology. Acquired employees mean the net headcount figure rises in places, but the score file is explicit that the essence of the pattern is contraction, not expansion. ServiceNow, which also announced a reduction of 1,000 people, scores 1 on the same item, and the file treats the two cases as the same shape. The score file also notes, as a methodology question for a future version of the model rather than as a change to this score, that an AI-absorption productivity path, in which artificial intelligence allows a company to do more with fewer people, is a candidate for version 1.1. Under the frozen version 1.0 model, however, there is no such path: a company that is shrinking its workforce three times in succession, at a revenue-per-employee level below half the benchmark, scores 1, and this body does not invent a more generous reading.
Share velocity scores 4 out of 5, the strongest speed item, and it measures a position rather than a pace. The Form 10-K narrative records more than 75 million contracted users and more than 65% of the Fortune 500 as customers, which is the language of a category leader. The score file is careful about the limits of that evidence: a quantitative market-share percentage is unconfirmed, so the score cannot rest on a precise share figure, and the pattern is the same as for Salesforce, ServiceNow, and Adobe, all of which are described as category leaders maintaining a position whose expansion speed is unconfirmed. The score of 4 therefore says that leadership is maintained, not that it is measurably expanding. In a mature market, that distinction matters. A leader that holds its ground while its growth rate decelerates is not failing, but it is also not demonstrating the share-taking velocity that blitzscaling rewards most highly.
Moat: installed-base gravity in place of a network effect
The moat section scores 33 out of 60, or 55.0 on the radar conversion, and its four items are network effects 8 out of 18, distribution scalability 7 out of 18, market size 8 out of 12, and gross margin 10 out of 12. The shape of that section is the analytical core of the Workday case, because it shows a moat that is real but of a particular kind: not a flywheel in which each additional user makes the product more valuable to every other user, but a gravitational field created by an installed base of people and money data that is expensive and disruptive to move.
Network effects score 8 out of 18, and the score file begins with a candid statement: there is no classical network effect here. The essence of the moat is installed-base gravity, a phrase the file uses deliberately, and it draws an explicit parallel with the anatomy used for Microsoft against Google, where Microsoft scored 12 on the same item. The mechanism is the system-of-record lock-in for people and money data, combined with workflow gravity: once a large enterprise runs its human resources and finance processes on Workday, the cost and risk of moving that data and those workflows elsewhere is high, and the platform becomes the place where adjacent processes naturally land. The quantitative evidence for that mechanism is stronger than a mere assertion. The gross revenue retention rate is approximately 97%, and expansion within existing customers accounts for approximately 60% of subscription growth, which is the measurable footprint of a land-and-expand structure: the company wins a customer once and then grows inside that customer. The score file places 8 at the top of the 5-to-9 anchor band described as a data and ecosystem effect, and it explains the one-point gap to ServiceNow, which scores 9 on the strength of 8 trillion transactions and a 98% renewal rate, as a difference in quantitative evidence rather than in kind. Workday's attempt to extend the lock-in vector is visible in the Agent System of Record, a registry, permissioning, and audit layer for both its own and third-party agents, and in the Agent Partner Network, but the score file notes that scale figures for those initiatives are undisclosed. The moat, as scored, is therefore the installed base itself, with an agent-era extension attempted but not yet quantified. A reader should not mistake the attempt for the achievement, and the score does not.
Distribution scalability scores 7 out of 18, and the evidence is a high-cost enterprise sales structure that has not qualitatively changed. Sales and marketing expense in fiscal 2026 was $2,616 million, equal to 27.4% of revenue, which is the signature of a business that wins customers through a paid sales force rather than through a product that distributes itself virally. Workday GO, a packaged offering for mid-sized companies, and the Workday Marketplace exist, but the score file records no qualitative change in the customer-acquisition-cost structure that would indicate a new distribution mechanism. The score sits in the same 5-to-9 anchor band as Salesforce and ServiceNow, described as paid-sales dependent but capable of repeated expansion, and the score of 7 reflects that judgement: distribution works and repeats, through the installed base and through cross-selling from human capital management into finance, planning, and agents, but it remains expensive, and it does not compound without continued sales spending. That is a meaningful limitation for a blitzscaling assessment, because a moat that must be re-bought customer by customer, even at a high retention rate, is a different asset from a moat that distributes itself.
Market size scores 8 out of 12, and this is where the borderline Gate 2 verdict flows directly into the score. The company's presented total addressable market is $276 billion, announced at the Financial Analyst Day on October 13, 2026 and carried through press reporting: approximately $176 billion for the core human capital management and finance markets plus approximately $100 billion for AI and platform expansion. Against that figure, the gate bar of approximately $95.5 billion, ten times fiscal 2026 revenue of $9,552 million, is only 35% of the claimed market, which would be a comfortable pass if the claim were accepted at face value. The score file does not accept it at face value, for three stated reasons, and this body preserves all three. First, the previous figure the company had presented was approximately $160 billion, so the market claim rose by a factor of about 1.7 in one year, and the score file applies a credibility discount to a company assertion that moves that fast. Second, the Form 10-K contains no quantitative total addressable market disclosure at all, so the claim has no filing anchor. Third, third-party estimates for the human capital management software market alone are far smaller: MRFR puts it at $45.1 billion in 2025 rising to $110.8 billion in 2035, and researchandmarkets puts it at $42.6 billion in 2025 rising to $71.1 billion in 2031. On those third-party figures alone, the gate bar of $95.5 billion reaches approximately 86% of the ten-year ceiling for the single human capital management market, which is a borderline pass at best; the pass only gains headroom when the finance software axis described in the 10-K and the AI and platform expansion are included, and that inclusion depends on accepting the range of markets counted. The score file applies a conservative principle, marking estimated items one band lower, and places Workday at the same level as Adobe, which also scores 8 on the basis of a large market without a precisely secured total addressable market figure, and below Salesforce at 9, whose broader third-party lineage is judged stronger. The score of 8 is therefore not a judgement that the market is small. It is a judgement that the market's size, as it can be verified from sources independent of the company's own presentation, is not yet large enough to be comfortable.
Gross margin scores 10 out of 12, the strongest moat item, and the figures show a software-grade margin profile with a flat-to-softening direction. Total gross margin was 75.7%, following a three-year sequence of 75.6%, then 75.5%, then 75.7%, which is essentially flat. Subscription gross margin was 82.7%, following a gentle decline from 84.4% to 83.6% to 82.7%. The GAAP operating margin improved from 2.5% to 4.9% to 7.5% over three years, and the non-GAAP operating margin improved from 25.9% to 29.6%, reaching 31.1% in the second quarter of fiscal 2027. The level is unambiguously software-grade, and the direction of operating margin is favourable, but the score stops at 10 rather than matching ServiceNow and Salesforce at 11 for a specific reason the score file names: total gross margin is flat, subscription gross margin is gently declining, and stock-based compensation of $1,626 million, equal to 17% of revenue, is the largest single factor in the 22-percentage-point gap between the GAAP and non-GAAP operating margins, with its absolute amount continuing to rise. A margin profile in which the headline non-GAAP figure depends that heavily on excluding a large and growing compensation cost is a real margin profile, but it is not quite the cleanest one in the peer group, and the score reflects that distinction rather than ignoring it.
Creative destruction: replacing the old order, and beginning to replace its own
Creative destruction scores 9 out of 15, or 60.0 on the radar conversion, with all three items scoring 3 out of 5: replacing the existing order 3, irreversible behaviour change 3, and cost-structure change 3. The uniformity of those three scores is itself informative. It describes a displacement that is real, that is under way rather than complete, and that is now entering a second phase in which the displacer faces disruption from the same direction it once came from.
Replacing the existing order scores 3 out of 5 because the original replacement is a mature achievement rather than a fresh one. The order being replaced is on-premise human capital management and finance software, exemplified by PeopleSoft and SAP installations, displaced by a single cloud platform. That displacement is Workday's core business, and it is substantially accomplished, which is precisely why the score is 3 rather than 5: the model reserves the top mark for a replacement still in its expansive phase, and this one has reached maturity. The new order now being attempted is a shift in the unit of charging itself, from per-seat billing to per-agent-work billing, embodied in the Agent System of Record and in Flex Credits, for which the score file records 200 contracted customers. That attempt is at the trial stage, not the established stage. The score file also names the paradox that makes this item more interesting than a routine mature-market score: the order being disrupted now includes Workday's own seat model. The company is attempting to lead a transition that, if it succeeds, cannibalises the pricing basis on which its installed base was built. Salesforce faces the same structural question with Agentforce, and the score file scores both companies at 3 on this item on the same logic. The score is therefore not a criticism of the original displacement, which succeeded, but a measured assessment of the second displacement, which has barely begun and whose target includes the displacer itself.
Irreversible behaviour change scores 3 out of 5, and the evidence is the strongest early signal in the creative-destruction section, carefully bounded. Agent-using customers numbered more than 5,500, up 35% quarter over quarter, on confirmed evidence from SEC filings, and more than 25% of new annual contract value in the second quarter of fiscal 2027 was AI-related, also confirmed. Those two figures together describe behaviour change in progress: customers are not merely hearing about agents but deploying them inside the system of record, and new spending is tilting toward AI at a rate that would have been implausible as a description of this business a short time ago. The score stops at 3 for the reason the score file gives for Salesforce at the same score: it is too early to describe agent-based working as the established standard across the enterprise market as a whole. The cloud transition of human capital management itself is irreversible and is already embedded in the core business, but the new wave, the agent order, has only early evidence. The distinction between a behaviour change that has happened inside one company's customer base and a behaviour change that has become the market's standard is the distinction the score is drawing, and it is a distinction worth preserving, because conflating the two is exactly how a narrative outruns its numbers.
Cost-structure change scores 3 out of 5, and here the evidence is about Workday's own costs rather than its customers'. The three consecutive restructurings and the improvement in GAAP operating margin from 2.5% to 7.5% are a clear demonstration by the company itself that its cost structure can be changed, and the score file records that self-demonstration as unambiguous. What is unconfirmed, and what holds the score at 3, is whether that change represents an AI-driven collapse in the cost structure of the industry as a whole or simply an efficiency programme inside one company. The score file notes the absence of direct evidence of the kind ServiceNow supplies, in the form of a chief executive's statement that AI is absorbing work, and it places Workday at the same score as Salesforce on the same logic. The caution is methodological as much as it is commercial: a company cutting its own costs three times is evidence about that company, and it becomes evidence about an industry only when the mechanism, AI absorbing work at scale, is demonstrated rather than inferred from the cuts themselves. This body therefore reports the restructurings and the margin improvement as confirmed facts about Workday, and the industry-wide interpretation as unconfirmed, exactly as the score file frames it.
Deductions and risks: small in total, specific in character
Deductions total only 3 points, which is why there is no FLAG, but the composition of those 3 points is more informative than their size. Debt scores 0, revenue quality scores 0, governance scores negative 2, and regulatory and social costs score negative 1. A reader who only noticed the small total would miss the structure: the financial items do not fire at all, and the entire deduction comes from governance and from one realised incident. That is a different risk profile from a company whose deductions come from leverage or accounting, and it changes what a future deterioration would look like.
Debt, at 0 out of a possible negative 10, does not fire, and the score file gives the arithmetic plainly. Senior notes outstanding have a principal of $3,000 million, maturing $1,000 million in 2027, $750 million in 2029, and $1,250 million in 2032, and a $1.0 billion revolving facility was undrawn. Against trailing-twelve-month revenue of approximately $10.2 billion, that debt is approximately 0.3 times revenue, well below the model's 2-times trigger. The score file nevertheless records an observation that a reader should not lose sight of, and it is the same observation that appears in the capital-velocity item: cash plus marketable securities fell from $8,017 million to $3,403 million in one year, a decline of 58%, reflecting $2.2 billion of acquisitions and $2.9 billion of repurchases. The model, as frozen, does not have a trigger for the speed of cash consumption as distinct from the level of debt, and the score file lists that gap as a candidate for a future version of the model, alongside the equivalent candidate for Salesforce. Stock-based compensation of $1,626 million, equal to 17% of revenue and rising in absolute terms, is recorded in the score file not as a debt item but as a factor in the gap between GAAP and non-GAAP profit. The debt score of 0 is therefore correct under the model and incomplete as a description of financial direction, and both halves of that sentence matter. The company is not over-levered by the model's test, and it is consuming its cash buffer at a pace that would deserve attention even if no trigger fires.
Revenue quality, at 0, also does not fire, and the score file's basis is clean: no revenue restatement and no audit-opinion issue are recorded. Three observations are preserved alongside that clean verdict, because they affect how profit figures should be read even when they do not indicate misstatement. Fiscal 2024 net income of $1,381 million included an income-tax benefit of negative $1,025 million, meaning that the trajectory of underlying earnings is better read from operating profit than from that year's net income figure. Second-quarter fiscal 2027 GAAP diluted earnings per share of $2.57 included a $1.52 tax benefit from an intellectual-property transfer, so that quarter's headline earnings per share should not be read as a pure operating result either. Professional services revenue was essentially flat over three years, moving from $656 million to $719 million, consistent with a strategy of handing implementation work to partners rather than growing it in-house. And no single customer accounts for more than 10% of revenue, which removes a concentration concern. None of those observations changes the score, and this body does not use them to imply a problem the score file does not assert. They are included because a reader who cites Workday's earnings figures without them would overstate the smoothness of the profit trajectory.
Governance, at negative 2 out of a possible negative 5, is the largest deduction, and it is grounded in a confirmed disclosure in the Form 10-K rather than in press speculation. Workday has a dual-class share structure: Class B shares carry 10 votes per share against 1 vote per Class A share, and Class B holders, including co-founders Dave Duffield and Aneel Bhusri and other insiders, control a majority of the voting power. Duffield and Bhusri have a mutual voting proxy arrangement under which, in the event of death or incapacity, the other assumes sole control, a provision the 10-K states explicitly. The score file judges this more concrete and more concentrated than the comparable case of Nebius, which scores negative 1 on the basis that a structure exists but its concentration is unconfirmed, and the two-point deduction reflects that difference in specificity. Elliott's investment of more than $2 billion, accompanied by a public statement of support for management, is recorded in the score file as not an offset, because an investor supporting management is not an external check on management. That judgement is worth stating plainly, because it is easy to misread a large supportive investment as a governance improvement. In this scorecard it is not. It is a capital signal, recorded in the capital-velocity item, and it does not dilute the concentration of voting power that the governance item measures. A co-founder's return as chief executive in February 2026, recorded in the score file's key drivers, sits in the same picture: leadership and voting control are concentrated in the founding group, and the score reflects that concentration as a structural fact, not as a finding of misconduct.
Regulatory and social costs score negative 1 out of a possible negative 5, the smallest deduction, and it rests on one realised event plus two stated risks. In August 2025, on press reporting, a social-engineering breach of a customer-relationship-management system exposed corporate contact information, with core systems unaffected, again on press reporting. The Form 10-K states the risk of loss or suspension of FedRAMP authorisation, which is a precondition for government business, and in May 2025, on press reporting, a sole-source contract with the Office of Personnel Management was cancelled. No quantified disclosure of a large fine or class action is confirmed in the score file, and this body marks that absence as unconfirmed rather than as proof that no such exposure exists. The deduction of 1, rather than 0 as for Salesforce and Nebius on this item, is the score file's way of distinguishing a company with a realised minor incident from companies with none recorded. It is a small deduction because the incident as reported was limited in scope, but it is not zero, because the incident did happen, and because the government-business risks stated in the filing are specific rather than generic.
What to watch: the three tests that will move this score
The score file's key drivers translate into three tests that a reader can apply to future filings without needing to anticipate their outcomes. The first test is whether the agent curve becomes a disclosed revenue line rather than a narrative supported by partial figures. The figures available at T are genuinely encouraging in direction and genuinely limited in completeness: more than 25% of new annual contract value from AI, more than 5,500 agent-using customers growing 35% quarter over quarter, and AI annual recurring revenue of approximately $600 million, up 200% year over year on press reporting from the Analyst Day, set against the fact that AI still represents only approximately 7% of subscription revenue on a press-reported conversion, with no separate disclosure of AI within subscription revenue. That combination is the definition of a narrative-to-numbers transition, and the score file names the separation of AI annual recurring revenue in disclosure as the point to watch in the next quarter. This body attaches no anticipated outcome to that test. If a future filing discloses AI revenue separately and that revenue grows as a share of subscriptions, the second-curve evidence strengthens. If disclosure remains partial while the agent customer count grows, the tension between the two figures persists, and the score's caution remains justified. Either way, the judgement will come from the filing, not from the direction of the customer count alone.
The second test is whether near-term demand and cash direction converge or diverge. Current remaining performance obligations growing 14.2%, faster than total backlog growth of 8.0% and faster than revenue growth of 13.1%, is a near-term demand signal that runs ahead of the headline growth rate, and it is the most encouraging forward-looking figure in the score file. Set against it is the cash trajectory: a 58% decline in cash plus marketable securities in one year, driven by buybacks and acquisitions that are themselves a bet on the future. The fiscal 2027 third-quarter results, for the quarter ending October 31, 2026 and expected in late November to early December 2026 on the score file's estimate, with the official investor-relations notice unconfirmed, are the first judgement point at which both lines can be read together in a new filing. This body records that date only as a future marker, with no anticipated outcome. What matters structurally is the pairing: if cRPO strength persists while the cash decline moderates, the capital-allocation story reads as investment funded by a growing backlog; if cRPO softens while cash continues to fall at a similar pace, the same buyback and acquisition programme reads as consumption of flexibility without a matching demand signal. The score file's methodology note, that a future version of the model might add a cash-consumption-speed trigger, is a reminder that the current model does not score that pairing directly, and a reader should therefore watch it as a judgement rather than expecting the next score to capture it automatically.
The third test is the one the score file names as the single largest blitzscaling risk for this company: the self-cannibalisation of the seat-pricing model. If AI agents replace per-seat billing with per-agent-work billing, the disruption target includes Workday's own core business, and the Agent System of Record and Flex Credits, with 200 contracted customers at T, are the company's attempt to own the successor pricing basis before it is imposed from outside. The variables to watch are the speed of that transition and the public disclosure of the pricing mix, neither of which can be judged from a single quarter's customer count. A transition that moves slowly, with Flex Credits adoption growing alongside seat revenue, would describe a company managing its own succession. A transition that moves quickly, with agent-work pricing displacing seat revenue faster than the new line grows, would describe the cannibalisation risk realising itself. The score file does not predict which path occurs, and neither does this body. It records the risk as structural, shared with Salesforce, and observable only through the pricing and revenue-mix disclosures of future filings, together with the governance and government-business items that, while small in deduction terms, define the constraints within which any transition must be managed.
Workday at 51/C is therefore a score that rewards a reader who holds two ideas at once. The first idea is that the business is substantial and durable: a category leader with more than 75 million contracted users and more than 65% of the Fortune 500 as customers, growing subscription revenue at 14.4%, retaining approximately 97% of its revenue, expanding inside its existing customers for approximately 60% of its subscription growth, and generating free cash flow of $2,777 million at a 29.1% margin. The second idea is that the evidence for the next phase is thinner than the narrative for it: a market claim that depends on the company's own presentation, a network-effect case that rests on installed-base gravity rather than a quantified flywheel, a growth rate that is decelerating, a workforce that has been restructured three times in succession, a cash pile that has fallen 58% in a year, a voting structure concentrated in its founders, and an agent business that is 25% of new contract value but only approximately 7% of subscriptions. The 14-point gap to the 65-point line is not a gap that one good quarter of agent customer growth would close on its own, because the gap is spread across market-size credibility, moat quantification, speed items, and governance. It would narrow if the agent revenue were disclosed separately and grew as a share of subscriptions, if the market-size claim gained an independent anchor, if the cash trajectory stabilised, or if the governance concentration diluted. Until filings show one or more of those changes, the honest summary is the score itself: a graduated blitzscaler, lowest among its mature peers not because its business has failed, but because its evidence for the next blitz is still catching up with its story.
More Platforms companies
Other Platforms names on the Blitz Index, highest score first: Alphabet (83/A), Meta (78/B), Airbnb (76/B).
Next earnings
Nov 24, 2026 · After close · Confirmed
Coverage
Workday, Inc. · Q3 FY2027 earnings late Nov–early Dec 2026 (unconfirmed) · Score 51 · Grade C
Embed this score
Copy the HTML below to show this score on your site. The badge links back to this page and updates automatically when the score changes.
Preview:
BlitzLab scores businesses against a scholar’s standard — not investment advice. No price targets, no buy/sell recommendations. Figures are from SEC filings (XBRL) as labeled in the source scorecard.