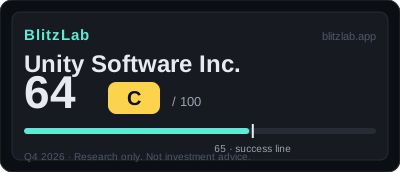
Unity Software Inc. — Blitz Index 64 (B)
Unity scores 64 — a mature platform re-accelerating on AI monetisation (Vector) while the engine itself grows just 2%.
Last re-scored: November 5, 2026.
Confidence: Medium · Category: platforms
Score breakdown
| Section | Score | Detail |
|---|---|---|
| A · Speed | 19 / 25 | Q2 2026 total +24% but strategic +38% vs Create +2% — re-acceleration is real yet only two quarters, after FY2024 −17.1% and FY2025 +2.0% |
| B · Moat | 42 / 60 | Two-sided platform (developers × advertisers) with Vector AI monetisation on the install base; 74.2% FY2025 gross margin — but the moat is re-won project by project, not locked in |
| C · Creative destruction | 10 / 15 | One cross-platform real-time 3D engine plus built-in monetisation replacing bespoke per-platform engines and separate ad stacks — mature on mobile, not full displacement in AAA |
| D · BlitzFailing | −7 | SBC $380.2M (20.6% of FY2025 revenue) plus a $279M Q1 2026 ironSource impairment; staggered board and sub-1% insider ownership |
Think we scored it wrong? Score it yourself →
Radar axes (0–100): Moat 70 · Speed 76 · Creative 67.
Watch item
Gates: G1 ✓ (conditional — second curve on Vector/Grow, not Create) · G2 ✓ (estimate, definition-dependent — engine-only market falls short of bar ≈ $20.28B). 1 point below the threshold — first score.
Strengths
- Strategic revenue +38% in Q2 2026 with Grow +63% — the second curve is outgrowing the engine
- Q2 2026 FCF $202M, adjusted EBITDA margin 29%, net cash ~+$115M — the turnaround is cash-backed
- Gross margin 66.5% → 73.5% → 74.2% (FY2025) on the portfolio reset
- Vector run rate $1B+ with Day-28 ROAS adoption above 25% (call-reported)
- >$100k customers 1,340 and DBNER recovered 96% → 103% — expansion is back
Concerns
- Total growth +24% masks Create at +2% — the engine, not the ads, is the question
- Two flat years precede the re-acceleration (FY2024 −17.1%, FY2025 +2.0%)
- SBC $380.2M is 20.6% of FY2025 revenue — dilution is a real cost, not an accounting quirk
- Q1 2026 $279M non-cash impairment on ironSource assets — the 2022 merger value largely written off
- The moat is re-won every project: Runtime Fee showed developers can leave for Godot or Unreal
Research notes
Thesis: A Mature Platform Trying to Grow a Second Curve on Top of the First
Unity Software is best understood, on the evidence in its BlitzLab score file, as a company whose first act is already finished and whose second act is only just beginning to show up in reported results. The first act was the conquest of mobile game development. On a press-reported basis, Unity's engine is used in roughly 70% of top mobile games, a position that makes it, in practical terms, the default tool for a large part of the mobile games industry. The second act is not a better engine. It is Vector, the machine-learning targeting product inside Unity's Grow business, which turns the installed base created by the first act into an advertising and monetization machine. Whether that second act can carry the company is the central question of this assessment, and the score file answers it with a deliberate qualification: growth has returned, but it is advertising-led growth, not engine-led growth.
Unity's BlitzLab score is 64 out of 100, grade B. The total is built from 19 points for speed out of 25, 42 points for moat out of 60, 10 points for creative destruction out of 15, and minus 7 points in deductions. In item terms: A = 19 (A1 = 8, A2 = 5, A3 = 2, A4 = 4), B = 42 (B1 = 12, B2 = 12, B3 = 8, B4 = 10), C = 10 (C1 = 4, C2 = 3, C3 = 3), D = −7 (D1 = −2, D2 = −3, D3 = −1, D4 = −1), for a total of 19 + 42 + 10 − 7 = 64. The score sits 1 point below the 65-point threshold, and the company carries no flag, because deductions of 7 are below the 15-point flag threshold. The shape of the score matters more than the headline. Moat and creative destruction are comparatively solid, at 42 of 60 and 10 of 15 respectively, while speed, at 19 of 25, is the constraint. That shape is the quantitative expression of the thesis: the platform position is real, the displacement story is real, but the pace at which the whole business is expanding is still held back by two years of stagnation and by an engine business that is growing only slowly.
The scoring date, T, is October 25, 2026. The latest reported quarter at T is the second quarter of 2026, reported on August 6, 2026. Third-quarter 2026 results, scheduled for November 5, 2026, fall after T and are therefore excluded from this assessment; they appear below only as a future marker. The score file rests primarily on Unity's filings with the United States Securities and Exchange Commission — its Form 10-K for fiscal 2025, filed February 11, 2026, and its Form 10-Q for the second quarter of 2026 — together with its investor-relations releases of May 7 and August 6, 2026, and call summaries and press reporting that are labelled as such wherever they are used. The company is classified in the score file as a mature platform plus a second curve, with trailing-twelve-month revenue of about $2.03 billion. Market capitalization is deliberately not stated as a single figure in this draft, because the score file records that press reports conflict, at $15.48 billion versus $17.58 billion, and that a single figure therefore cannot be cited as settled. A share price of $40.79, dated October 23, 2026, is recorded in the score file on a press-reported basis, and valuation is not part of the score, which evaluates the business rather than its price.
Two gates precede any scoring, and both pass, but each pass carries a qualification that should be kept in view throughout. The first gate, sustained growth or a second growth curve, passes on a mixture of confirmed and press-reported evidence. Product-market fit itself is not in doubt on the file's evidence: the mobile engine's near-standard position, more than $100,000 customers numbering 1,340 at September 30, 2025, on a press-reported table, and a dollar-based net expansion rate recovering from 96% in 2024 to 100% at June 30, 2025, and 103% at September 30, 2025, on the same press-reported table, all point to an installed base that is expanding again rather than shrinking. The second curve is Vector, not the engine: strategic revenue rose 38% in the second quarter of 2026, strategic Grow revenue rose 63%, and Vector's annualized run rate exceeded $1 billion on a call press-reported basis. The score file is explicit that Vector is a figure inside Grow, not a separate segment, and that it must not be double-counted. It is also explicit that the engine itself, with total Create revenue up only 2% in the second quarter of 2026, is low-growth, so the first gate passes only because of the Vector second curve.
The second gate, a ten-year revenue ceiling at least ten times current revenue, passes on an estimate and depends on the definition of the market. The bar is approximately $20.28 billion, defined as ten times trailing-twelve-month revenue of $2,028.4 million. On the engine licensing market alone, estimated in press reporting at about $8 billion in 2025, the bar would not be met, and the gate would fail under that narrow definition. The pass rests on a broader definition: the engine plus mobile advertising and monetization, described in press reporting at the level of tens of billions of dollars, plus non-game real-time three-dimensional visualization for automobiles, architecture, manufacturing, and medical uses, whose share of revenue is undisclosed. On that combined definition, the ceiling exceeds the bar. The score file adds the important corrective that the real constraint is not the size of the market but Unity's ability to take share within it, against AppLovin, Unreal, and the platforms' own advertising businesses, and that constraint is reflected in the market-size score rather than hidden by the gate pass.
Speed: Re-acceleration in Its Second Quarter, Not Yet a Track Record
Growth, scored 6 out of 10, is the story of a company coming out of a two-year stall. Fiscal 2024 revenue fell 17.1%, and fiscal 2025 revenue grew only 2.0%. Against that base, 2026 shows re-acceleration: total revenue rose 17% in the first quarter and 24% in the second quarter, strategic revenue rose 35% in the first quarter and 38% in the second, and first-half 2026 revenue rose 20.4% on a calculated basis. Trailing-twelve-month revenue of $2,028.4 million is up 14.0% year over year on a press-reported and estimated basis. The re-acceleration is real, but the score file withholds full marks for a precise reason: it amounts to two quarters of evidence, and the fiscal base from which it is measured is weak. Two quarters can show a turn; they cannot yet establish a sustained growth rate, and the score of 6 reflects that distinction.
That discipline extends to forward-looking figures. The company has guided to third-quarter strategic revenue of $540 million to $550 million, up 44% to 47%, but the score file treats that guidance strictly as a company outlook, not as a result, and it is not counted in the score. It is noted here for the same reason: as a marker of what the company itself has projected, not as evidence of what has happened. When third-quarter results are reported, the relevant comparison will be between the reported strategic, total, and Create figures, not between a single headline growth rate and the outlook. The distinction between those three layers — total revenue up 24%, strategic revenue up 38%, and total Create up 2% in the second quarter of 2026 — is the single most important habit for reading Unity's results, because the strategic label, as discussed under revenue quality below, carries a definitional effect that can flatter the headline if the total is omitted.
Capital velocity, scored 4 out of 5, tells the other half of the turnaround story: Unity has returned to funding itself from its own cash generation. In the second quarter of 2026, operating cash flow was $206 million and free cash flow was $202 million, against $133 million and $127 million respectively in the prior-year period. First-quarter free cash flow was $66 million, against $7 million a year earlier. Cash of $2,352.0 million against convertible notes of $2,237.4 million leaves net cash of about $115 million on a calculated basis, a reversal from net debt of about negative $180 million at December 31, 2025, within the first half of 2026. Even the $557 million of convertible notes classified as current, maturing in 2026, falls within a range that cash could cover. The fifth point is withheld because the turnaround in cash generation sits alongside a continuing GAAP loss and stock-based compensation dilution, which is scored separately as a deduction. Self-funding is a genuine achievement, but it is not yet the same as GAAP profitability, and the score keeps those two facts apart.
Hiring and productivity, scored 2 out of 5, is the lowest speed item, and its low score is a statement about what kind of company Unity now is. This is not a blitz hiring story. It is a story of productivity achieved by reduction: about 1,800 people, about 25%, were cut in January 2024, with further cuts in the first half of 2025 carrying about $20 million of severance costs recorded in the Form 10-Q. Research and development spending was $929.5 million in fiscal 2025, essentially unchanged from $924.8 million in the prior year, while sales and marketing spending fell from $752.6 million to $652.9 million and general and administrative spending fell from $410.1 million to $268.5 million. The cost base shrank while the research base held, which is the arithmetic behind the margin expansion discussed below. The score is held to 2, however, because confirmed headcount could not be extracted from the filings reviewed, and press reports conflict, at 4,412 versus 4,987. With no settled headcount figure, revenue per employee cannot be calculated, and the score file refuses to build an argument on an unconfirmed number. That refusal is worth noting as method: where the file does not know, it says so and scores conservatively, rather than choosing the more flattering press figure.
Share-of-market velocity, scored 3 out of 5, completes the speed section with a picture of expansion returning, but slowly. Customers spending more than $100,000 rose from 1,222 in 2023 to 1,254 in 2024, then to 1,270 at June 30, 2025, and 1,340 at September 30, 2025, the last figure on the press-reported table noted above. The dollar-based net expansion rate recovered over the same arc, from 96% to 100% and then to 103%. The direction is consistent: existing customers are spending more, and the customer count is rising. The pace of that customer-count increase is modest, however, and the reach figures that might suggest faster share gains — 9.4 million Unity 6 downloads and about 3 billion monthly consumer touchpoints, both on a call press-reported basis — are not treated as confirmed share evidence, which is why the item stops at 3. One confirmed structural fact supports the section: no single customer accounted for more than 10% of revenue in the first half of 2025, confirmed in the Form 10-Q, so the expansion is broad-based rather than dependent on one relationship.
Moat: A Real Two-Sided Platform, Capped by the Project Boundary
The moat section, at 40 of 60, is the strongest part of the score in absolute terms, and each of its four items describes a different facet of the same platform. The network effect item, scored 11 out of 18, is the most analytically interesting, because Unity's network effect is a cross-side effect rather than a consumer viral effect. On one side are developers, bound by engine skill, asset libraries, and code — the switching costs of a development stack built over years. On the other side are advertisers, who are drawn by runtime scale, which feeds Vector's targeting data, which draws advertising spending, which in turn improves monetization for developers. Vector's annualized run rate above $1 billion, on a call press-reported basis, and adoption of day-28 return-on-ad-spend measurement above 25%, also on a call press-reported basis, are the early quantitative signs that this cross-side loop is operating. The ceiling on the score comes from two discounts. First, a cross-side effect without consumer virality has a lower upper bound than a consumer network. Second, and more importantly, the Runtime Fee episode of 2023 demonstrated that the installed base cannot be treated as locked in: at the boundary between projects, developers can and do switch, with press-reported surging interest in Godot as the visible evidence. A moat that must be re-won project by project is real, but it is not the same as a moat that compounds automatically, and 11 out of 18 records that difference.
Distribution scalability, scored 12 out of 18, is the strongest moat item, and it rests on the software character of the distribution itself. A free Personal tier, up to $200,000 as described in the score file, forms the top of the funnel; paid Pro seats, priced at $2,200 per seat per year on the confirmed anchor set in September 2024, with a 2026 price of $2,310 reported on a press-reported basis, and Enterprise seats convert that funnel into paying customers; and Grow products are then sold onto the resulting installed base, as described in the score file, without building a separate distribution system for the advertising business. Reach is global, and a non-game industrial three-dimensional vector exists, although its revenue share is undisclosed. The discount, again, is the speed of the underlying engine seat business: a distribution system can be highly scalable and still grow slowly if the product it distributes — in this case engine seats, with total Create up only 2% — is not itself pulling quickly. Scalability of the channel and velocity of the product are different things, and the score rewards the first while the second holds the item below the maximum.
Market size, scored 8 out of 12, follows directly from the second gate analysis. The combined market of engine, mobile advertising and monetization, and non-game real-time three-dimensional applications exceeds the $20.28 billion bar, so the item is solidly positive. It stops short of the maximum for two reasons that are already familiar: the engine market alone would fall short of the bar, which caps the ceiling, and Unity's share within the broader market is constrained by the competitive structure — AppLovin and Unreal on the one hand, and the platforms' own advertising offerings on the other. The item would reach full marks, on the score file's terms, only with demonstrated non-game and industrial revenue from Vector and with confirmed advertising share figures submitted as numbers rather than described at the press-reported level. Market size, in other words, is not Unity's ceiling; market share is.
Gross margin, scored 9 out of 12, is the most conventionally impressive moat item and the clearest evidence that the portfolio reset did something structural. Gross margin rose from 66.5% in fiscal 2023 to 73.5% in fiscal 2024 and to 74.2% in fiscal 2025, on confirmed figures of $1,371.9 million of gross profit on $1,849.6 million of revenue. Adjusted EBITDA margin expanded alongside it, from 21% in fiscal 2024 to 22% in fiscal 2025 and to 29% in the second quarter of 2026. That is a software margin structure, and it is the financial counterpart of the cost reductions described under hiring: a smaller sales, marketing, and administrative base spread over a recovering revenue base. The discount is the gap between that adjusted picture and GAAP results. The GAAP operating margin in fiscal 2025 was negative 25.9%, and the GAAP net margin was negative 21.7%, and the gap is explained by stock-based compensation of $380 million and intangible asset amortization of $419 million. Those are not cash costs in the same sense as salaries or server bills, but they are real costs to shareholders and to reported earnings, and the score file handles them in the deductions section rather than letting the gross margin item pretend they do not exist.
Creative Destruction: Replacing a Fragmented Stack, Project by Project
The creative destruction section, at 10 of 15, captures what Unity displaces and how durable that displacement is. The order being replaced, scored 4 out of 5, is the combination of platform-specific bespoke engines and a separate advertising and monetization stack. Unity replaces that combination with a single cross-platform real-time three-dimensional engine with monetization built in. On mobile, that replacement is mature: the press-reported figure of about 70% of top mobile games indicates a market in which the displacement has largely already happened. In high-end personal computer and console AAA development, by contrast, the displacement is partial: on a press-reported basis, Unreal leads Unity in Steam revenue, at 31% versus 26%. The item therefore scores highly for the clarity and scale of the target being replaced, but not at the maximum, because the replacement is not universal across all tiers of game development.
Irreversible behavior change, scored 3 out of 5, is where the score file is most careful, and the care is justified by the company's own recent history. Within a project, the binding forces are strong: a multi-year build, a C-sharp codebase, an asset pipeline, and a team's accumulated skill all make switching mid-project costly and unlikely. At the boundary between projects, however, reselection occurs, and the years 2023 to 2024 demonstrated that reversibility in practice, with press-reported surging interest in Godot and Unreal after the Runtime Fee episode. Vector adoption, with day-28 return-on-ad-spend measurement above 25% on a call press-reported basis, represents behavior change on the advertiser side, but it is still partial. The score file's formulation is precise and should be preserved: this is not behavior change at the level of irreversibility, but behavior at the level of having to be re-won project by project. A score of 3 records a real change in how developers build and how advertisers buy, without overstating its permanence.
Cost-structure change, scored 3 out of 5, has the same two-layer structure. For developers, the cost collapse is real: a single codebase shipping simultaneously to mobile, personal computer, console, and extended reality replaces the cost of building separately for each platform. Vector's machine-learning targeting offers a second cost change, replacing manual mediation and media buying, and that change is indirectly evidenced by Grow's growth, although per-unit cost measurements have not been publicly disclosed. Unity's own cost-structure improvement, by contrast, is attributed in the score file not to technology but to cuts and the portfolio reset described under hiring. A technology-driven cost change for customers and a restructuring-driven cost change for the company itself are different achievements, and the item's score of 3 keeps them distinct rather than blending them into a single story of efficiency.
Deductions and Risks: Light Debt, Heavy Dilution, and a Merger Write-Down
Deductions total minus 8, composed of minus 3 for debt, minus 3 for revenue quality, minus 1 for governance, and minus 1 for regulatory and social cost. No single deduction is large, and the total is well below the flag threshold, but the composition tells the risk story more accurately than the total alone.
Debt, scored minus 3 out of a possible minus 10, is a case where the label is misleading if read alone. The debt itself is light: net cash of about $115 million, fiscal 2025 interest expense of only $24.0 million, and the $557 million current convertible portion within cash-coverable range, as described above. The deduction is driven not by borrowing but by dilution and reset costs. Stock-based compensation in fiscal 2025 was $380.2 million, equal to 20.6% of revenue, down from 25.9% in fiscal 2024 but still material, with the second quarter of 2026 at about 14% on a call press-reported basis. Restructuring costs were $46.8 million in fiscal 2025, down from $266.9 million in fiscal 2024. The direction of both series is improving, and the score file records that improvement, but the level of stock-based compensation remains a real cost borne by shareholders through dilution, and the item's minus 3 reflects that cost rather than any distress in the balance sheet.
Revenue quality, scored minus 3, carries two distinct concerns, and the score file is careful to distinguish them from fraud. First, no finding of accounting fraud, restatement, or auditor change was identified in this scoring pass, but the file does not present that absence as a definitive clean-audit conclusion, and neither does this draft. The scored concerns are narrower. One is the definitional effect of the strategic and non-strategic reclassification: because strategic revenue grows faster than total revenue, the two figures must always be presented together — total revenue up 24% alongside strategic revenue up 38% in the second quarter of 2026 — or the headline will overstate the whole business. That is an interpretation risk, not an accounting irregularity, but it is a risk that recurs every quarter the reclassification is in use. The second concern is the ironSource merger asset write-down: a $279 million non-cash impairment in the first quarter of 2026, following the sunset of the Ads Network on April 30, 2026, and the sale of Supersonic on August 4, 2026, about three and a half years after the November 2022 merger. A write-down of that scale, that soon after a merger, is recorded in the score file as a record of capital allocation failure in that transaction, regardless of how the current advertising business is performing. The past merger's cost and the present product's performance are separate facts, and the deduction keeps them separate.
Governance, scored minus 1 out of a possible minus 5, is the mildest structural deduction, and its mildness is itself informative. There is no differential voting structure: Unity has a single class of common stock, one share one vote, as summarized in 2026 proxy reporting on a press-reported basis, with the caveat that the definitive proxy statement was not directly read, so the point is not presented here as confirmed from the filing itself. The company is not founder-controlled, and leadership is a post-crisis regime, with Bromberg in place from May 2024. The small deduction reflects two press-reported governance features: a staggered board, and combined director and officer ownership below 1% on the proxy summary, indicating weak insider alignment in the score file's terms. Neither feature is scored as a control problem of the kind that dominates some other companies' governance deductions; together they amount to a note that those running the company own relatively little of it, which is a weaker alignment signal than a concentrated insider stake would provide.
Regulatory and social cost, scored minus 1, follows a similar pattern of absence plus residue. No material litigation finding was recorded: the third-quarter 2025 Form 10-Q states that the company was not a party to material litigation at that time, and a Delaware derivative suit was dismissed with finality on July 22, 2025, as recorded in the second-quarter 2025 Form 10-Q. The Form 10-K's risk categories — artificial intelligence intellectual property, privacy, regulation, competition, and technological change — exist as categories, but no specific enforcement action is recorded in the file. The small deduction is therefore not for litigation but for the residual trust cost of the Runtime Fee episode. The policy itself was fully abolished in September 2024, and the seat-based pricing system returned, which the score file treats as an institutional step toward restoring trust. The residue is that the episode left soil in which competitors, notably Godot, could grow, and that trust, once spent, is recovered more slowly than a pricing schedule can be rewritten. That residue is the thread connecting the governance, network effect, and creative destruction scores: the same event that damaged trust also capped the moat and demonstrated the reversibility of developer behavior.
Two further features of the record deserve emphasis because they shape how the whole assessment should be read. The first is the revenue composition of fiscal 2025, confirmed in the filings: Create revenue of $621 million and Grow revenue of $1,228 million, together making up the $1,849.6 million total. Grow is therefore about two-thirds of the business, which is why the second gate's broader market definition is not an abstraction: the company's revenue already comes mostly from the advertising and monetization side, not from engine licensing alone. The second is the GAAP loss that persists alongside the cash turnaround: a fiscal 2025 net loss of negative $401.5 million, and a second-quarter 2026 net loss of negative $23 million. The score file notes a company outlook for a GAAP net profit turn in the third quarter of 2026, but that outlook is a company projection, not a result, and it is recorded here only as a marker to be checked against the reported quarter. The gap between free cash flow of $202 million and a GAAP net loss in the same quarter is, on the file's evidence, the gap created by stock-based compensation and intangible amortization, not by cash burn, and understanding that gap is essential to understanding why the company can be self-funding and GAAP-loss-making at the same time.
What to Watch: The Markers That Would Move the Score
The score file's own stated path to the 65-point threshold is clear and does not require embellishment: sustained total revenue growth in the twenties percent range, strategic growth in Create reaching double digits, and stock-based compensation falling into single digits as a share of revenue. Each element of that path corresponds to a specific weakness in the current score — speed held back by the engine, and dilution held against an otherwise light balance sheet — and each can be tracked in reported figures without relying on projections. The markers below are organized around that path, together with the risks that could interrupt it.
The first marker is the third quarter of 2026, scheduled for November 5, 2026, after T. It is the first new evidence on every trend described here, and the informative comparison will be the three-layer split: total revenue, strategic revenue, and Create revenue, read together, with the company's strategic outlook of $540 million to $550 million treated as the company's own prior projection rather than as a result. A quarter in which strategic growth remains strong but total growth and Create growth stay close to their second-quarter pattern would confirm the current diagnosis — a second curve carrying a slow first curve — rather than changing it. A quarter in which Create itself reaches double-digit strategic growth would be the first evidence that the engine side is re-accelerating alongside Vector, which is the change the path to 65 requires.
The second marker is Vector itself, and the discipline required in reading it. Because Vector is a figure inside Grow rather than a separate segment, its run rate above $1 billion, on a call press-reported basis, and its day-28 return-on-ad-spend adoption above 25%, also on a call press-reported basis, should be tracked as indicators within Grow's reported growth, not added to Grow as if they were additional revenue. The question to watch is whether strategic Grow growth, at 63% in the second quarter of 2026, is sustained at a level that continues to lift total growth, or whether it moderates toward the total as the comparison base strengthens. The same discipline applies to customer metrics: whether the count of customers above $100,000 continues to rise from 1,340, and whether the dollar-based net expansion rate holds at or above the 103% level recorded at September 30, 2025, on a press-reported basis, since expansion, in the score file's account, is the mechanism by which the installed base converts into revenue growth.
The third marker is the cash and dilution pair, which must be read together. Free cash flow of $202 million in the second quarter of 2026, net cash of about $115 million, and the coverage of the $557 million current convertible portion establish the balance-sheet side. Stock-based compensation, at 20.6% of revenue in fiscal 2025 and about 14% in the second quarter of 2026 on a call press-reported basis, establishes the dilution side. The score file's path requires the second series to keep falling toward single digits while the first series repeats; a reversal in either series would reopen the debt deduction, even though the balance sheet itself remains light. The restructuring series, down from $266.9 million to $46.8 million, is a secondary marker of the same reset: whether the costs of the 2024 reset have genuinely ended, or whether further reset charges appear.
The fourth marker is trust at the project boundary, which is the score file's named maximum risk in blitzscaling terms: that developers choose another engine for their next project. This risk does not announce itself in a single quarter's revenue, because existing projects continue to generate revenue while new projects are being chosen elsewhere. It appears later, and more slowly, in customer counts, in expansion rates, and in the competitive position described in press reporting — Godot's growth on the one hand, and Unreal's lead in high-end Steam revenue on the other. The institutional facts are already in place for recovery — the Runtime Fee policy abolished in September 2024, seat-based pricing restored, and a post-crisis leadership regime in place since May 2024 — but the score file's judgment is that recovery in trust is measured in project cycles, not in policy announcements. Watching the engine side, therefore, means watching whether new project choices, as reflected over several quarters in Create and in customer metrics, begin to match the strength of the advertising side.
The fifth marker is the absence of new adverse findings to match the two historical deductions. On revenue quality, that means no new large impairment of merger assets and no widening of the gap between the strategic headline and the total that would make the definitional effect harder to read. On governance and regulation, it means continued absence of material litigation findings of the kind whose absence the score file records, and no new policy episode that would reopen the trust cost already scored. Neither marker requires a positive event; both require the continued absence of a negative one, which is a useful reminder that a score of 64 with small deductions is a position to be held as much as a position to be improved.
Unity's story, as the evidence stands at October 25, 2026, is that of a platform that survived its own crisis by shrinking its cost base, restoring a pricing system developers could accept, and then finding a second growth engine inside the installed base it had already built. The engine that made the company a standard in mobile games is growing slowly; the advertising product built on top of that standard is growing quickly; the cash generation has turned positive on a free-cash-flow basis while GAAP results still carry the costs of past compensation and past acquisitions; and the moat, though real, must be re-earned with each new project. The score of 64, grade B, 1 point below the threshold, captures that balance: a mature platform with a credible second curve, a solid moat, and a displacement story that is genuine but incomplete, held back by speed that has only just returned and by dilution that has only just begun to fall.
More Platforms companies
Other Platforms names on the Blitz Index, highest score first: Alphabet (83/A), Meta (78/B), Airbnb (76/B).
Next earnings
Q4 2026 · Expected
Coverage
Unity Software Inc. · Q3 2026 due Nov 5, 2026 (BMO, confirmed) · Score 64 · Grade B
Embed this score
Copy the HTML below to show this score on your site. The badge links back to this page and updates automatically when the score changes.
Preview:
BlitzLab scores businesses against a scholar’s standard — not investment advice. No price targets, no buy/sell recommendations. Figures are from SEC filings (XBRL) as labeled in the source scorecard.