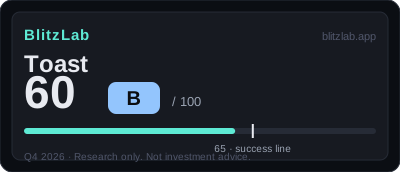
Toast — Blitz Index 60 (B)
GPV $61.8B (+20%), ARR $2.5B (+24%), 189,000 locations (+21%) — the GAAP operating turnaround (−$287M to +$292M, Q3 $165M) rides on the spread, not the gross.
Last re-scored: November 3, 2026.
Confidence: High · Category: platforms
Score breakdown
| Section | Score | Detail |
|---|---|---|
| A · Speed | 20 / 25 | All four KPIs growing in the 20s: locations +21%, ARR +24%, GPV +20%, recurring gross profit +27% |
| B · Moat | 34 / 60 | No true network effect; switching-cost moat plus a data flywheel feeding Toast Capital underwriting |
| C · Creative destruction | 11 / 15 | Legacy on-premise POS replaced by a cloud all-in-one stack — SaaS + fintech are 97% of revenue |
| D · BlitzFailing | −5 | Founders hold 51.0% voting power; interchange regulation risk; hardware GP 9M −$225M loss leader |
Think we scored it wrong? Score it yourself →
Radar axes (0–100): Moat 56.7 · Speed 80 · Creative 73.3.
Watch item
Gates: G1 ✓ · G2 ✓ (borderline). 5 points below the threshold — Q3 2026 rescore (no item changes). The restaurant OS at the harvest of blitz act one, seeding act two on internal cash.
Strengths
- 4 KPIs all growing in the 20s (locations +21% · ARR +24% · GPV +20% · recurring GP +27%)
- Net add of +8,500 locations in Q3 — the distribution engine is running
- GAAP operating profit Q3 $165M (~2× YoY) + FY2026 recurring GP guide raised to +26%
- Subscription GP margin 71.8% — the software core's margin
Concerns
- Founders' combined 51.0% voting power — absolute control over act two's capital allocation
- G2 rests on a 2023-vintage global TAM — the US alone falls short of the $71.5B bar
- Hardware GP 9M −$225M, already above the FY2025 full-year −$220M — buying stores with hardware
- CFO Gomez steps down Dec 31, 2026; Senno succeeds Jan 1, 2027 — second senior leadership change
Research notes
**Score summary (BlitzLab v1.0, T = 2026-11-03, Q3 2026 rescore — no item changes):** Speed (A) 20/25 + Moat (B) 34/60 + Creative Destruction (C) 11/15 − Demerits (D) 5 = 60/100, Grade B. Item scores: A1 8, A2 4, A3 4, A4 4; B1 7, B2 10, B3 8, B4 9; C1 4, C2 4, C3 3; D1 0, D2 0, D3 −3, D4 −2. No FLAG. The total sits five points below the 65-point threshold, and the whole of that gap sits in the moat section.
Thesis: a restaurant operating system that earns a thin spread at large scale
Toast, founded in 2011 by Aman Narang, Stephen Fredette, and Jonathan Grimm and listed in September 2021, sells restaurants a single stack: point-of-sale software, payments, hardware, and adjacent services such as capital. The score file classifies the company as mature, with trailing-twelve-month revenue of about $7,152 million and a market capitalisation of about $17.3 billion at the scoring date. That headline revenue figure, however, is the first thing a reader of this profile has to unlearn. In fiscal 2025, $5,037 million of $6,153 million in revenue — about 82 percent — was payments revenue recognised on a gross basis. Under that accounting, described in Note 2 to the 2025 Form 10-K, Toast acts as principal in managed payments and records interchange in cost of revenue. The business underneath is therefore not best described as a $6.8 billion revenue company in the ordinary sense. It is a company that processes a very large flow of restaurant payments and keeps a narrow spread on that flow, alongside a subscription software business. The score file puts the net take rate at about 0.61 percent of gross payment volume (third-quarter fintech gross profit of $380 million on $61.8 billion of gross payment volume). That single normalisation shapes almost every judgement that follows, including the growth score and the gross-profit score, and it is why this profile keeps returning to the distinction between gross flow and kept economics.
On the numbers available at T, the core restaurant business was still growing at a pace unusual for a company of this size. Locations reached about 189,000, up 21 percent year on year, with a quarterly net addition of about 8,500 locations in the third quarter of 2026, following the record net addition of about 9,500 in the second quarter. Annualised recurring revenue reached $2.5 billion, up 24 percent, gross payment volume reached $61.8 billion, up 20 percent, and recurring gross profit on a non-GAAP subscription-plus-fintech basis reached $642 million, up 27 percent. Four headline indicators growing together in the 20 percent range is the empirical core of the growth case. It is also the reason the first gate in the scoring model — sustained growth or a second growth curve — passes on confirmed evidence: the home restaurant business itself is still expanding, even though the contribution of the second curve, in retail, enterprise hospitality, and four overseas markets, remains undisclosed.
Growth has decelerated from the earliest years, and the score reflects that plainly. Revenue rose from $1,705 million in fiscal 2021 to $2,731 million in fiscal 2022, up 60.2 percent, then to $3,865 million in fiscal 2023, up 41.5 percent, $4,960 million in fiscal 2024, up 28.3 percent, and $6,153 million in fiscal 2025, up 24.1 percent, with the trailing-twelve-month figure at $7,152 million on a calculation from reported figures. Third-quarter 2026 revenue grew 21.3 percent year on year, after 23.1 percent in the second quarter, and fiscal 2026 guidance for recurring gross profit was raised to growth of 26 percent, from 23 to 25 percent. The pattern is one of slowing percentage growth on a much larger base, combined with the gross-recognition structure that inflates the revenue line relative to the economics kept. That combination is why growth scores 8 out of 10 rather than higher: strong and broad, but decelerating and optically flattered by accounting.
The second part of the thesis is financial discipline arriving after a period of deliberate spending. GAAP operating income moved from a loss of $287 million in fiscal 2023 to a profit of $16 million in fiscal 2024, the first profitable year on that measure, then to $292 million in fiscal 2025, $152 million in the second quarter of 2026, and $165 million in the third quarter of 2026, about double the prior-year quarter. Operating cash flow was $661 million and free cash flow $608 million in fiscal 2025. The company carries no long-term borrowings, holds net cash of about $796 million — cash and equivalents of $1,203 million plus marketable securities of $682 million against total liabilities of $1,089 million — and left its revolving facility undrawn. In the first half of 2026 it repurchased $486 million of shares under a $750 million programme, leaving $264 million remaining, with no repurchases in the third quarter. The share price itself had fallen 17 percent year to date at the scoring date, within a 52-week range of $22.26 to $39.72, which the score file notes as a narrowing of the equity window even though the absence of debt leaves capital access itself in good shape. The scoring model does not score price, and this profile does not either; the price facts are recorded here only as context for capital conditions, not as a judgement about value.
Put together, the thesis is straightforward. Toast has built a large, still-growing installed base of restaurants that run on its stack, it has turned that base profitable on a GAAP operating basis, and it funds itself without long-term debt. What it has not yet demonstrated, at the scoring date, is a moat strong enough to carry it over the 65-point line, or a quantified second act large enough to settle the long-run market question. The score of 60 is, in that sense, a portrait of a completed first act awaiting its second.
Moat: switching costs and distribution, not a classic network effect
The moat section is where Toast loses the points that keep it below 65, scoring 34 out of 60, and the shortfall is structural rather than incidental. The largest single moat item, network effects, scores only 7 out of 18. The score file is explicit about why: there is no genuine demand-side network effect between restaurants. One restaurant joining Toast does not make Toast more valuable to the next restaurant in the way that a marketplace or a social platform gains value with each additional participant. What exists instead is lock-in through switching costs. A restaurant that adopts Toast signs an integrated subscription-plus-payments arrangement, invests in hardware that becomes a sunk cost, and trains staff on menus, inventory, payments reconciliation, and reporting inside the Toast system. Leaving means retraining, reconfiguration, and disruption to daily service. That is a real friction, but it is a friction of exit, not a force of attraction, and the score places it in the middle of the anchor range for weak but present data and ecosystem effects.
Two softer reinforcements sit alongside those switching costs. First, the operating data generated by restaurants on the platform feeds back into Toast Capital underwriting, creating a data flywheel in which the lender learns from the operating system it already runs. Second, a partner ecosystem continues to integrate around the stack. Neither is quantified in the score file as a standalone revenue or retention figure, and neither is allowed to carry the weight of a true network effect. The honest reading is that Toast's defensibility rests on integration and habit rather than on increasing returns from the restaurant network itself.
Distribution, by contrast, is the strongest moat item at 10 out of 18, and it is the engine most visible in the quarterly numbers. The combination of direct sales and channel sales has repeatedly added locations, culminating in the record quarterly net addition of about 9,500 in the second quarter of 2026, followed by about 8,500 in the third quarter, and sustained location growth of 21 percent year on year. Geographic expansion from the United States into the United Kingdom, Ireland, Canada, and Australia is under way, and adjacent markets in retail and enterprise hospitality are in progress, including enterprise expansion evidenced by BWH Hotels point-of-sale approval. The score file is careful about the limit here: there is no viral element. Growth is earned through paid and sales-dependent distribution that can be repeated, but it must be paid for again with each cohort. The score of 10, chosen conservatively between the anchor ranges for repeatable but sales-dependent expansion and for stronger distribution, reflects that distinction. A distribution machine that adds a record number of locations in a quarter is impressive; a distribution machine that must keep selling to keep growing is a different kind of moat from one that sells itself.
Market size scores 8 out of 12, and the reasoning is inseparable from the second gate of the scoring model. That gate asks whether the ten-year market ceiling is at least ten times current revenue. Ten times trailing revenue of about $7,152 million sets a bar of about $71.5 billion. The company presented a global total addressable market of more than $110 billion in a third-quarter 2023 investor presentation, built on about 22 million restaurants globally and more than $2.6 trillion in dining sales, citing sources including the Bureau of Labor Statistics, IBISWorld, the National Restaurant Association, Freedonia, and Euromonitor. That figure is 1.54 times the bar, so the gate passes mechanically, but the score file records three constraints that keep the market score from rising higher. The United States market alone, at $55 billion on the company's presentation, falls short of the bar, so the pass depends on global penetration. The total addressable market figure dates from 2023 and does not reflect subsequent retail and overseas expansion, which is both a potential upward factor and a source of uncertainty. And the bar itself consumes 65 percent of the presented global market, leaving only 1.54 times of headroom. Adjacent markets — retail, enterprise hospitality, Toast Capital, and advertising — could raise the ceiling, but the company has not quantified them. The gate therefore passes as a borderline case, following precedents in the scoring history for borderline passes with documented reasoning, with the global assumption and the United States-only shortfall stated openly rather than smoothed over.
Gross profit scores 9 out of 12, and here the accounting normalisation matters most. The overall gross margin was 25.9 percent in fiscal 2025, up from 18.4 percent in fiscal 2021. Beneath that headline, the mix tells the story. Subscription gross margin was 71.8 percent, on $672 million of subscription gross profit, which is the margin of a software business. Fintech gross margin was 22.7 percent, on $1,146 million of fintech gross profit, because interchange sits inside cost of revenue under gross recognition. Hardware gross profit was negative $220 million in fiscal 2025, a margin of negative 122 percent, and negative $225 million in the first nine months of 2026 alone, reflecting a deliberate loss-leader strategy. Recurring gross profit on a GAAP basis was $1,818 million. The upward drift in the overall margin from 18.4 percent to 25.9 percent is therefore driven less by any collapse in unit costs than by mix shift toward higher-margin subscription revenue. That is a genuine improvement, but it is a mix improvement, and the score file keeps that label intact. Two shadows sit on the same page: hardware losses grew in absolute terms from negative $170 million to negative $220 million as scale expanded, and past that in the first nine months of 2026 to negative $225 million, while second-quarter 2026 free cash flow of $130 million fell 37 percent year on year, attributed to working-capital movement. The third quarter resolved the second shadow — free cash flow of $181 million, up 18.3 percent year on year — while the first shadow deepened. Neither changes the gross-profit score at T, but both qualify any simple story of margin expansion.
Speed: a mature company still adding locations at a record pace
Speed scores 20 out of 25, the strongest of the three scored axes when converted to a comparable scale, and it is the section that most clearly reflects a company still in motion rather than one harvesting a finished position. Growth contributes 8 points, as discussed above. Capital velocity contributes 4 out of 5: no long-term debt, net cash of $577 million, an undrawn revolver, and a buyback programme already more than half executed in the first half of 2026 all support access to capital, even as the year-to-date share-price decline narrows the equity channel. Hiring and productivity contribute 4 out of 5: about 6,500 employees on a confirmed Securities and Exchange Commission filing basis, revenue per employee of about $1.10 million on a trailing basis, and the operating-income turnaround from a $287 million loss to a $292 million profit as evidence that the organisation produces more profit per unit of effort than it did. Share-of-market velocity contributes 4 out of 5: locations up 21 percent, a quarterly net addition of about 8,500, gross payment volume up 20 percent, and annualised recurring revenue up 24 percent, held back from the maximum only because the company discloses no United States restaurant market-share figure against which to anchor a full score.
The speed story is therefore not a story of a young company sprinting before economics matter. It is a story of a mature company, by the model's classification, that continues to add its core unit — the restaurant location — at a record quarterly pace while converting that growth into operating profit and cash flow. The deceleration in percentage revenue growth is real, from 60 percent to the low 20s over five fiscal years, but the absolute additions and the four-indicator breadth of growth keep the speed score high. What speed cannot do on its own is lift the total over the threshold when the moat section trails by so much. Speed without a correspondingly strong moat is the central tension of the 60-point result.
Creative destruction: replacing two old orders with one stack
Creative destruction scores 11 out of 15, and its three items describe a coherent replacement story. The order being replaced scores 4 out of 5. The legacy order was on-premises point-of-sale hardware combined with a separate payments terminal and separate back-office software — three purchases, three vendors, three data silos. Toast replaces that arrangement with a cloud all-in-one stack that bundles point of sale, payments, hardware, and capital under a single contract and a single data pipe. In doing so it erodes two older orders at once: the legacy point-of-sale vendor and the independent payments sales organisation. Software-as-a-service plus fintech accounted for 97 percent of fiscal 2025 revenue, which is the quantitative signature of how complete that bundling has become within the company's own revenue mix.
Irreversible behaviour change scores 4 out of 5. Once a restaurant moves its operating system to the cloud — staff training, menus, inventory, settlement, and loan repayment all running through the Toast pipe — reverting is not a casual decision. The continued growth in locations and in annualised recurring revenue is presented in the score file as quantitative evidence of that lock-in. The limit is disclosed with equal clarity: per-location churn and retention rates are not disclosed, so the strength of lock-in cannot be measured precisely. The score therefore credits the behaviour change that the disclosed growth implies, without pretending to a retention figure the company has not published.
Cost-structure change scores 3 out of 5, the lowest item in this section, and the reasoning is a useful corrective to any claim that Toast collapses costs. About 77 percent of fintech cost is interchange, an external and regulated variable that Toast does not control. Economies of scale therefore show up not as control over the largest cost line but as negotiating leverage with processors and efficiency in fraud detection, expressed in the thin net spread of about 0.61 percent. The movement in overall gross margin from 18.4 percent to 25.9 percent is, as noted above, a mix story — higher-margin subscription revenue growing within the total — rather than a cost-collapse story. A company that earns its living as a spread-taker on a cost it does not set will always score more modestly on cost-structure transformation than a company that removes a cost altogether, and the score keeps that distinction visible.
Deductions and risks: governance dominates, regulation shadows the spread
Deductions total negative 5, well below the 15-point level that would trigger a FLAG, and no FLAG applies. The composition matters more than the total. Debt and revenue quality each score zero, meaning no trigger fires on either. There is no long-term borrowing, total liabilities of $1,136 million equal only 0.17 times trailing revenue and consist mainly of payables, deferred revenue, and accrued expenses, customer funds of $159 million are trust-like in nature, and the revolver is undrawn. On revenue quality, there is no restatement, no auditor change, and no audit-opinion issue; the auditor is EY, gross recognition of payments revenue is explicitly disclosed in Note 2 to the Form 10-K and reconciles between the XBRL data and the body text, share-based compensation has fallen from 8.2 percent of revenue in fiscal 2021 to 3.9 percent, and GAAP operating profit of $292 million is assessed as being of good quality. A clean debt and accounting slate is the foundation on which the rest of the score rests, and it is worth stating plainly because it is what allows the discussion to focus on strategy rather than on solvency or reporting integrity.
Governance is the largest single deduction, at negative 3 out of a possible negative 5, and it is structural. Toast has a dual-class structure: Class A shares carry one vote per share and Class B shares carry ten votes per share. The three founders together control 51.0 percent of voting power on a confirmed proxy-statement basis — Narang 18.4 percent, Fredette 22.5 percent, and Grimm 10.1 percent — which is absolute control. Institutional investors own Class A shares with diluted voting power. The score file places this on an anchor line that runs from a company with about 32.8 percent founder voting power scoring negative 2, through Toast at 51.0 percent and a peer at 58.8 percent scoring negative 3, to a peer at about 76 percent scoring negative 4. The deduction is therefore not a judgement about any individual founder; it is a judgement about a structure in which the direction of a second growth act — different capital allocation, different risk appetite, different acquisition choices in retail, overseas markets, or enterprise hospitality — rests entirely with three people. The score file also records two planned leadership transitions, with the chief revenue officer retiring on 31 December 2026 and the president and chief financial officer stepping away at the end of the calendar year, succeeded by the senior vice president of finance on 1 January 2027, as governance-adjacent facts to note rather than as separate deductions. The blitzscaling reading of this risk is pointed: a second act often demands different leadership and different risk-taking from the first act, and an absolute-control structure concentrates that transition in very few hands.
Regulatory and social cost contributes negative 2 out of a possible negative 5. The central exposure is interchange itself. Changes to interchange fees through legislation or litigation settlement are named in the Form 10-K risk factors, and because Toast's spread sits on top of interchange, a regulatory change to that fee goes directly to the economics of the fintech business. Related exposures include Durbin and Regulation II considerations and the fact that, as principal, Toast bears first responsibility for chargebacks and fraud losses. Sensitivity to small-business economic conditions is also named in the Form 10-K. Competition is recorded on a press-reported basis — Block and Square, Shift4, and Fiserv's Clover are named as competitors, with the score file noting that the Form 10-K itself does not name competitors — and press reporting of a Square artificial-intelligence voice kiosk launch is noted in the same press-reported category. No material litigation is recorded under Item 3 of the Form 10-K. The regulatory deduction is therefore moderate rather than severe: a real, named, direct exposure to the fee that defines the spread, without a current material legal overhang.
Beyond the scored deductions, the score file records several open concerns that a reader should carry alongside the headline score. Hardware losses are growing in absolute terms even as they win locations. Second-quarter free cash flow fell sharply year on year on working-capital movement; the third quarter confirmed the recovery, with free cash flow of $181 million, up 18.3 percent year on year. The market-ceiling argument depends on a 2023 global market figure that has not been refreshed. Churn and retention by location are undisclosed, limiting any precise measurement of lock-in. And the contribution of retail, enterprise hospitality, and four overseas markets remains undisclosed, so the second growth curve is a direction rather than a measured revenue line at T. None of these is hidden in the score file; all of them are part of why a company with 20 percent-range growth across four indicators and a clean balance sheet still scores 60 rather than higher.
What to watch: the second act, the spread, and the next disclosure
The watchlist that follows from the score file is short, because the score file itself is disciplined about what is known and what is not. The first item is the quantification of the second act. Retail, enterprise hospitality at the scale of the BWH Hotels approval, and the four overseas markets — the United Kingdom, Ireland, Canada, and Australia — are all described as in progress, but none carries a disclosed revenue contribution at T. The next disclosures that attach numbers to those efforts, whether in segment commentary, location commentary by market, or a refreshed market-size presentation, will do more to settle the long-run ceiling question than any further quarter of home-market growth alone. A refreshed global market figure would also retire the most dated input in the gate analysis: the 2023 presentation on which the borderline pass currently depends. Until that refresh arrives, the ceiling argument remains anchored to a document that predates the very expansion it is being asked to justify.
The second item is the spread and the costs around it. The net take of about 0.61 percent of gross payment volume, the fintech gross margin of 22.7 percent, and the interchange share of fintech cost at about 77 percent together define a business whose profitability is sensitive to variables it does not fully control. Regulatory developments affecting interchange, processor negotiations, and fraud and chargeback experience are therefore not background noise; they are first-order inputs to the fintech gross profit line. The hardware loss line belongs on the same watchlist, read as a customer-acquisition cost rather than as an operating accident: the question is not whether hardware loses money — it is designed to — but whether the lifetime spread earned from each acquired location justifies a loss that grows in absolute terms with scale. The score file raises exactly that framing, and it is the right one.
The third item is cash conversion. Fiscal 2025 operating cash flow of $661 million and free cash flow of $608 million sit alongside a third-quarter 2026 free cash flow figure of $181 million, up 18.3 percent year on year, which resolves the second-quarter working-capital flag — free cash flow of $130 million, down 37 percent year on year — in the company's favour. The same discipline applies to the buyback: $486 million repurchased in the first half of 2026 under a $750 million programme leaves $264 million remaining, with no repurchases in the third quarter, and the pace and completion of that programme are observable facts for future disclosures.
The fourth item is governance in motion. The planned retirement of the chief revenue officer on 31 December 2026 and the departure of the president and chief financial officer at the end of the calendar year are named, dated leadership changes, and the founder voting concentration of 51.0 percent means that succession, capital allocation, and any larger strategic turn will be read through that structure. No further inference is drawn here beyond what the filings record, but the combination of a leadership transition and absolute founder control is precisely the configuration the score file identifies as the largest blitzscaling risk: the risk that the governance that completed the first act constrains the second.
Finally, the calendar marker has been observed. Third-quarter 2026 results, reported after the market close on November 3, 2026, are included in this rescore: locations of about 189,000, recurring gross profit of $642 million on a non-GAAP basis, gross payment volume of $61.8 billion, free cash flow of $181 million, and no item change to the score. The next disclosure marker is the fourth quarter, guided at recurring gross profit of $610 million to $620 million, and any quantification of retail, enterprise, or overseas contribution.
Toast at 60/B is best understood as a company that has proved the first part of its story and has not yet proved the second. The first part — an integrated restaurant stack, growing locations at a record pace, profitable on a GAAP operating basis, funded without long-term debt, and clean on debt and revenue-quality checks — is substantial, and the speed and creative-destruction scores recognise it. The second part — a moat that goes beyond switching costs, a market ceiling refreshed beyond a 2023 presentation and beyond the United States alone, and a second growth curve measured in revenue rather than described in direction — is still to be demonstrated. Five points separate the current score from the threshold, and all five would have to come from strengthening the moat. That arithmetic is the clearest possible statement of what the next chapter has to contain.
More Platforms companies
Other Platforms names on the Blitz Index, highest score first: Alphabet (83/A), Meta (78/B), Airbnb (76/B).
Next earnings
Q4 2026 · Expected
Coverage
Toast, Inc. · Q3 2026 reported Nov 3, 2026 · Score 60 · Grade B
Embed this score
Copy the HTML below to show this score on your site. The badge links back to this page and updates automatically when the score changes.
Preview:
BlitzLab scores businesses against a scholar’s standard — not investment advice. No price targets, no buy/sell recommendations. Figures are from SEC filings (XBRL) as labeled in the source scorecard.