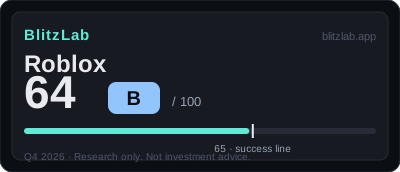
Roblox — Blitz Index 64 (B)
bookings $6.79B (+55%) against GAAP $4.89B (+36%) — the lead indicator is decelerating while the headline accelerates.
Last re-scored: October 29, 2026.
Confidence: High · Category: platforms
Score breakdown
| Section | Score | Detail |
|---|---|---|
| A · Speed | 19 / 25 | FY2025 bookings $6.79B (+55%); Q2 2026 bookings +8% — the lead indicator is decelerating |
| B · Moat | 43 / 60 | DevEx $1.5B+/yr creator lock-in; 18+ cohort hours +40%, spend +50%; Japan DAU +67% |
| C · Creative destruction | 12 / 15 | Zero-marginal-cost UGC + AI creation tools — the user-to-creator flywheel |
| D · BlitzFailing | −10 | Child-safety litigation (MDL 3166); Baszucki 58.8% vote; SBC 19–23% of revenue |
Think we scored it wrong? Score it yourself →
Radar axes (0–100): Moat 71.7 · Speed 76 · Creative 80.
Watch item
Gates: G1 ✓ · G2 ✓. 1 point below the threshold — first score. The creator economy's strongest lock-in against the industry's heaviest regulatory shadow.
Strengths
- FY2026 guidance: bookings +8–12%, revenue +20–25%
- DevEx $1.5B+ creator payouts
- FCF $1.35B (+111%) — second straight cash turnaround year
- Japan DAU +67% · India +64%
Concerns
- Q2 bookings +8% — headline +36% masks lead-indicator deceleration
- MDL 3166 child-safety litigation (148 cases) + 3 state AGs
- Age-verification rollout slowed the signup pipeline (company-admitted)
- SBC 19–23% of revenue — structural dilution
Research notes
1. Current Position
Roblox Corporation (NYSE: RBLX) scores 64 out of 100, Grade B, on the BlitzLab v1.0 model in the 2026Q4 scoring round, with the assessment dated to 16 October 2026. The arithmetic is worth stating at the outset, because the rest of this assessment is an attempt to explain how the parts add up and why one point matters so much. Speed contributes 19 of 25 points, Moat contributes 43 of 60, Creative Destruction contributes 12 of 15, and Demerits subtract 10, so 19 plus 43 plus 12 minus 10 equals 64. On the radar axes that BlitzLab derives from those sections, Moat stands at 71.7 on a 100-point conversion, Speed at 76.0, and Creative Destruction at 80.0. The shape of the score is therefore uneven in an instructive way: the creative-destruction axis is the strongest, the moat axis is the weakest of the three positive axes, and the demerit total is large enough to matter without reaching the FLAG trigger. Roblox clears both gates, G1 and G2, so scoring proceeds in full, but it falls short of the 65-point threshold that BlitzLab uses as its success line, by exactly one point. It carries no FLAG, since demerits of 10 sit below the 15-point trigger. The company is classified as growth, with trailing-twelve-month revenue of about 5.69 billion dollars, precisely 5,686 million dollars in the score file, and a market capitalisation of roughly 34 to 37 billion dollars on a press-reported basis at T. This is a first scoring for Roblox, with no blind-scoring history behind it, and the company reached the public market through a direct listing in March 2021.
That framing, a company one point below the line with both gates passed, changes how every figure that follows should be read. A score of 64 is not a verdict of failure, and it is not a near miss that can be rounded up by enthusiasm. It is a measurement that says the explosive phase is documented, the cash generation is documented, and yet the re-acceleration that would confirm a durable second curve is not yet documented. The score file itself names the stage plainly: Roblox is in a period passing the peak of a second growth curve, in which the viral explosion of the second half of 2025 has normalised into single-digit bookings growth in 2026. The question the score poses is whether the explosion proved itself in margin and in repeatable monetisation, or whether it proved itself mainly in attention. Free cash flow, at 1,353 million dollars for fiscal 2025, up 111 percent, points toward the first reading. Bookings growth of 8 percent in the second quarter of 2026, set against revenue growth of 36 percent in the same quarter, points toward the second reading, or at least toward a more complicated reading in which both things are true at once. The assessment that follows tries to keep both readings in view at the same time, because the score file insists on that discipline: bookings are the leading indicator in a deferred-revenue business, and revenue is the lagging recognition of bookings already made.
Gate G1, which asks whether sustained growth or a second growth curve is evidenced, is marked as a confirmed pass. The evidence is fiscal 2025 bookings of 6,788 million dollars, up 55 percent, on a confirmed basis from the annual filing adjustment table, average daily active users of 127 million, and free cash flow of 1,353 million dollars. Behind those annual figures sits a specific second curve: viral titles in the second half of 2025, Grow a Garden, Steal a Brainrot, and 99 Nights in the Forest, drove bookings growth of 70 percent and daily active user growth of 70 percent in the third quarter of 2025, followed by bookings growth of 63 percent and daily active user growth of 69 percent in the fourth quarter of 2025, both on a press-reported basis. The slowdown in the second quarter of 2026, bookings up only 8 percent, is explicitly not read in the score file as user attrition, because daily active users rose 10 percent and hours rose 5 percent on a confirmed basis from the quarterly filing. The distinction matters. Users kept arriving and kept spending time; what softened was the rate at which that time converted into bookings. That is a monetisation-mix question, not an abandonment question, and the rest of the score is organised around understanding the mix.
Gate G2, which asks whether the ten-year ceiling of a new market reaches at least ten times current revenue, is marked as a pass on an estimated basis, with its weakness recorded rather than smoothed away. The bar is about 56.9 billion dollars, ten times trailing-twelve-month revenue of 5,686 million dollars. The global games market total addressable market of roughly 200 billion dollars per year, a company estimate cited in the second-quarter 2026 shareholder letter, is about 3.5 times the bar, so the gate passes on that measure. The score file immediately records the vulnerability in the argument: the company's own stated ambition of capturing 10 percent of the global games content market would imply revenue of roughly 20 billion dollars, only about one third of the bar. Passing on the whole market while falling short on the company's own stated ambition means the ten-year case depends on expansion beyond games as currently defined, into social and user-generated-content adjacencies, and that dependence is an assumption rather than a demonstrated result. The score file is explicit that this is a hypothesis, not evidence, and this assessment preserves that label. A conditional pass that names its own condition is more useful than a confident pass that hides one.
The valuation note in the score file, which does not enter the score, records a market capitalisation of roughly 34 to 37 billion dollars at T, on a press-reported basis with the share price around 51 dollars, a price-to-trailing-revenue multiple of about 6 times, a price-to-bookings multiple of about 4.8 times, and a 52-week range of 33.88 to 141.95 dollars, a fall of 64 percent from the high, also press-reported. The business score deliberately does not consider price, a principle the score file attributes to the ARK testing lesson, and this assessment follows the same rule: the market figures are context for the capital discussion in the Speed section, not an input to the score and not a judgement about value.
2. Moat: The Creator Economy as a Lock-In
The Moat section, at 42 of 60, is the largest block of the score and also the block where the assessment is most distinctive. Roblox does not defend itself primarily with proprietary technology that competitors cannot reproduce, nor with a distribution contract that competitors cannot match. It defends itself with people whose livelihoods run through the platform, and with users whose social lives, avatars, friend graphs, and accumulated virtual assets sit inside it. That is a different kind of moat from a patent wall or a scale advantage in manufacturing, and the four moat items measure its separate strands.
The first item, B1 on network effects, scores 14 of 18. The mechanism is a two-sided flywheel between creators and users: tens of millions of experiences on one side, more than 100 million daily active users on the other. The score file gives the flywheel a financial shape that is unusual in platform assessments: creators received more than 1.5 billion dollars in 2025 through the Developer Exchange programme, on a press-reported basis. The significance of that figure is not merely its size. It is what the figure represents, which is that leaving the platform would mean abandoning an income stream, not merely abandoning a habit. Habits can be broken by a better product. Livelihoods resist breaking even when a better product appears, because the cost of moving is measured in earnings rather than in inconvenience. On the user side, the lock-in is built from avatars, friend graphs, and accumulated virtual assets, the familiar accumulation that makes any social platform sticky, here compounded by the fact that the content itself is produced by the community the user belongs to. The score stops at 14 rather than rising into the 15 to 18 anchor band for platform lock-in, for two reasons the score file states plainly. First, in an attention market, the lock-in does not reach the level of impossibility associated with a peak-era social network, because attention can always be diverted to a rival experience. Second, the quantitative evidence for the lock-in is not disclosed by the company in the form the model would prefer, so a conservative principle holds the score at the top of the two-sided market liquidity band rather than above it. That conservatism is a feature of the method, and it recurs throughout the file: where the company has not disclosed a measurement, the score does not invent one.
The second item, B2 on distribution scalability, scores 13 of 18. The distribution footprint is genuinely broad: mobile, personal computer, console including Xbox and PlayStation, and virtual reality are all covered, so the platform meets users wherever they already play. The viral title Grow a Garden demonstrated a second kind of distribution, in which the product itself distributes, because a user-generated experience can spread through the community without a marketing campaign behind it. Geographic penetration adds a third strand: Japan daily active users rose 67 percent and India daily active users rose 64 percent in the second quarter, both on a press-reported basis, showing that the platform is still expanding into new markets rather than merely deepening in its home market. The discount factors are structural rather than temporary. When distribution passes through an app store, Apple or Google take up to 30 percent in fees, a figure confirmed in the annual filing, which means a substantial share of the value created on the platform is captured by gatekeepers the platform does not control. And the second distribution engine that might diversify away from that dependence, advertising, is described in the annual filing as insignificant. A platform that distributes everywhere but monetises mainly through one channel, with a toll taken by others on a large part of that channel, earns a strong but not maximal distribution score. The 13 reflects breadth achieved and diversification still missing.
The third item, B3 on market size, scores 7 of 12, and it is here that the G2 vulnerability reappears inside the scored items rather than only in the gate discussion. The gate passes on the total addressable market, but the scored item asks a harder question: how much headroom stands between the bar and the ceiling? The bar of 56.9 billion dollars against a total addressable market of 200 billion dollars leaves only about 3.5 times headroom, which is thin for a model that asks for tenfold growth. The company's own 10 percent ambition implies about 20 billion dollars, below the bar. Reaching tenfold growth would require capturing roughly one third of the entire games market as currently sized, or expanding the definition of the market through user-generated-content games and social adjacencies for which no demonstration yet exists. The score of 7 records that thinness honestly. It does not deny the size of the games market, and it does not pretend that the market as sized is enough. It says the ceiling is large in absolute terms and tight in relative terms, and that distinction is the whole point of the item.
The fourth item, B4 on gross margin, scores 9 of 12, and it requires careful reading because two different margin figures describe the same business. On a generally accepted accounting principles basis, the gross margin is about 80 percent in the second quarter, calculated from revenue of 1,469 million dollars against cost of revenue of 292 million dollars, where cost of revenue is centred on payment processing fees, on a confirmed basis from the quarterly filing. That is a software-like margin, and it reflects the economics of a platform that does not manufacture the content it distributes. The honest adjustment, which the score file makes explicitly, subtracts Developer Exchange payments of 363 million dollars, or 24.7 percent of revenue in the quarter, and arrives at about 55 percent. That adjusted figure is the more meaningful measure of what the platform keeps after paying the creators who make it worth visiting, and it is still a strong margin. The cash generation corroborates the margin story: free cash flow of 294 million dollars in the second quarter, up 66 percent year on year, and 1,353 million dollars for fiscal 2025, up 111 percent, describe a two-year turnaround in cash creation. The discount factors are equally concrete. Stock-based compensation was 282 million dollars in the second quarter, or 19.2 percent of revenue, and the business continues to record generally accepted accounting principles net losses of 185 million dollars per quarter. Revenue is recognised over an average paying-user life of 27 months, an estimated figure, so the margin in any single quarter is a blend of bookings made over more than two years. A margin that is high, cash-backed, and still loss-making on a GAAP basis is not a contradiction; it is the profile of a platform paying for its creator economy in equity and recognising its revenue slowly, and the score of 9 holds those facts together without resolving them into a simpler story.
3. Speed: Growth That Is Real, Capital That Is Patient
The Speed section, at 19 of 25, describes a company that grows quickly in users and in bookings over the full year while growing slowly in the most recent quarter, and that holds ample cash while facing a closed equity window. Those two facts pull in opposite directions, and the four Speed items separate them so that neither cancels the other silently.
The first item, A1 on growth, scores 8 of 10. The annual evidence is strong: fiscal 2025 revenue of 4,890.6 million dollars, up 36 percent, and bookings of 6,788 million dollars, up 55 percent, both confirmed from the annual filing adjustment table. The five-year bookings path, from 2.73 billion dollars to 6.79 billion dollars, implies a compound annual growth rate of about 20 percent. The most recent quarter supplies the warning that caps the score: second-quarter 2026 bookings growth of only 8 percent, set against revenue growth of 36 percent, and a revised fiscal 2026 bookings guidance range of growth of 8 to 12 percent, lowered on the first-quarter earnings call of 30 April 2026, on a press-reported basis. The score file is precise about what would earn 9 or 10 points, namely sustained bookings growth in the 30 percent range, and it is equally precise about why that is not currently evidenced. Growth itself is not in question; the rate of bookings growth, which is the leading indicator, has decelerated sharply from the 70 percent and 63 percent prints of the second half of 2025. An 8 recognises a growth record that is strong over five years and strong over fiscal 2025, while refusing to award top marks for a pace the latest quarter does not show.
The second item, A2 on capital velocity, scores 3 of 5, and it is the clearest example in the file of quality without velocity. The quality is not in doubt: cash of 991 million dollars plus short-term investments of 2,023 million dollars plus long-term investments of 3,070 million dollars gives liquidity of 6.08 billion dollars, against long-term borrowings of 1,009 million dollars, so the company is effectively in a net cash position. The velocity is a different matter. The share price fell from a 52-week high of 141.95 dollars to about 51 dollars, a decline of 64 percent, on a press-reported basis from market data sources dated 16 October 2026, which means the equity financing window is effectively closed. No share repurchases and no dividends are disclosed. The score file contrasts this with companies that score 4 on this item through continuous financing activity, and the contrast is instructive: Roblox is not blitzing with capital, in the sense of raising and deploying funds quickly to seize a market, but rather enduring on accumulated cash. Cash that is held rather than deployed at speed is a strength for survival and a weakness for blitzscaling, and the score of 3 records both halves of that judgement. A platform with 6.08 billion dollars of liquidity does not face a funding crisis; a platform whose equity window is closed and which discloses no repurchase activity is not converting capital access into competitive speed.
The third item, A3 on hiring and productivity, scores 4 of 5. The workforce is 3,065 regular employees, of whom about 75 percent, more than 2,300 people, work in product and engineering, on a confirmed basis from the annual filing. Bookings per employee are approximately 2.21 million dollars for fiscal 2025, on a calculated basis, which the score file compares with a peer at about 0.88 million dollars scoring 3 on this item, making Roblox roughly 2.5 times as productive per head on this measure. That is the signature of a platform business: a relatively small employed workforce supports an enormous creator workforce that is not on the payroll, so revenue per employee overstates the labour involved while still capturing something real about leverage. The score stops at 4 rather than rising higher because the denominator covers regular employees only, and outsourced and contract workers may be excluded, so the productivity figure is treated as partly estimated and the score is held back on a conservative principle. The conservatism is consistent with the treatment elsewhere in the file: a figure whose denominator is uncertain earns credit for direction, not for precision.
The fourth item, A4 on share velocity, scores 4 of 5. The company states that about 4 percent of global games revenue passes through Roblox, in the second-quarter shareholder letter, and the calculated figure from bookings of 6.79 billion dollars against a total addressable market of 200 billion dollars is about 3.4 percent, close enough in order of magnitude to corroborate the claim. Fiscal 2025 bookings growth of 55 percent against single-digit market growth implies rapid share expansion, which is the core of the item. The point withheld reflects the nature of the evidence: the 10 percent ambition is a stated ambition rather than a trajectory, and no independent measurement of share is disclosed. A company can claim a share path; only reported results can prove one. The score of 4 therefore credits the direction and the arithmetic while reserving the final point for independent confirmation that the trajectory, rather than the ambition, is real.
4. Creative Destruction: Replacing the Studio Order
The Creative Destruction section, at 12 of 15, is the strongest of the three positive sections, and it is where the blitzscaling claim is most convincing. All three items score 4 of 5, a uniformity that suggests a coherent destruction story rather than a single striking fact surrounded by weaker ones.
The first item, C1 on the order being replaced, scores 4 of 5. The order in question is the traditional games structure in which studios develop titles and publishers distribute them, and the replacement is a user-generated-content platform on which tens of millions of experiences compete directly with professional studio titles for screen time and for spending. Robux transactions are the monetisation of the destruction itself: essentially all of fiscal 2025 bookings of 6,788 million dollars come through this channel, with advertising and licensing confirmed as insignificant in the annual filing. That is a strong claim, because it means the new order does not merely sit alongside the old one as a curiosity; it transacts at a scale comparable to a major publisher. The point withheld reflects coexistence: professional AAA titles continue to exist and to thrive, so the replacement is partial rather than complete. The axis of the order is moving, as the score file puts it, but the old order has not been extinguished. A destruction score of 4 rather than 5 is the correct posture for a transition that is under way rather than finished, and it avoids the common error of declaring victory while the incumbent is still standing.
The second item, C2 on irreversible behavioural change, scores 4 of 5. The irreversibility is argued on two levels, and the score file keeps them distinct. For creators, the cash settlement of the creator economy, more than 1.5 billion dollars per year on a press-reported basis, means that livelihoods are bound to the platform, which is the strongest form of lock-in because it is measured in income rather than in preference. For users, the accumulation of avatars, friend graphs, and virtual assets, together with the entrenchment of Roblox as the default leisure environment for users under 18, creates a behavioural pattern that is costly to abandon even when alternatives exist. A further strand is institutional: age verification reaching 57 percent penetration, together with the introduction of Kids and Select accounts in the second quarter, on a confirmed basis from the shareholder letter, means that regulation is operating in a direction that strengthens the platform's institutional standing rather than merely constraining it. The score stops at 4 because the quantitative demonstration of irreversibility is not disclosed. The mechanisms are visible and the magnitudes are large, but the model requires measured proof of irreversibility before awarding full marks, and the file does not claim to have it. That restraint is consistent with the treatment of B1, where the same missing measurement held the score below the anchor band.
The third item, C3 on cost-structure change, scores 4 of 5. In a user-generated-content model, the marginal production cost of content is approximately zero for the platform, because the platform supplies the engine and the infrastructure while creators supply the content. That is a structural cost advantage over a studio model in which each new title requires a dedicated production budget, and it is the economic foundation of the platform's scale: tens of millions of experiences could not exist if each one had to be financed like a traditional title. Investment in artificial intelligence game-creation tools, including text-to-three-dimensional-asset generation and Build tools, on a confirmed basis from the shareholder letter, is pushing production costs lower still, by reducing the skill and time required to create an experience. The point withheld reflects the same evidential discipline as elsewhere: no quantitative measurement of the unit-cost collapse is disclosed, so the score records the mechanism as confirmed and the magnitude as unconfirmed. A cost revolution whose size has not been measured is a structural fact awaiting quantification, not a quantified fact, and the assessment says so plainly.
Read together, the three creative-destruction items describe a coherent blitzscaling position. The platform replaces the studio-publisher order with a creator-user order, binds both sides through livelihoods and accumulated social assets, and does so on a cost structure in which content is nearly free at the margin. That is the classic pattern of creative destruction in platform markets, and the section score of 12 of 15, or 80.0 on the radar conversion, is the highest of the three positive axes for that reason. The destruction story is stronger than the moat story and stronger than the speed story, which is itself informative: Roblox is better at changing the structure of its market than it is at defending the position that change has won, or at converting that change into accelerating bookings in the latest quarter.
5. Deductions and Risks: Dilution, Control, and the Cost of Safety
The Demerits section totals minus 10, composed of minus 2 for debt, minus 1 for revenue quality, minus 3 for governance, and minus 4 for regulatory and social cost. That total is large enough to move the overall score by a full grade boundary, since two points separate Roblox from the 65-point threshold and the demerit total is five times that gap, yet small enough to avoid a FLAG. Understanding the four items separately matters, because they describe four different kinds of risk that do not behave in the same way.
The first item, D1 on debt, scores minus 2, and the composition of that score is counterintuitive in a useful way. Borrowing itself is minor: long-term borrowings of 1,009 million dollars in 2030 Notes at 3.875 percent, against liquidity of 6.08 billion dollars, with interest of 10 million dollars per quarter against adjusted earnings before interest, taxes, depreciation, and amortisation of 152 million dollars. On borrowing alone, there would be little to deduct. The substance of the deduction is stock-based compensation dilution: 1,129 million dollars for fiscal 2025, or 23.1 percent of revenue, and a five-year cumulative total of 3,792 million dollars, both confirmed from the annual filing XBRL data. That is a structural dilution of per-share value, year after year, and it is the price the company pays for talent in a form other than cash. Total liabilities of 9,616 million dollars look alarming until they are decomposed: most of that figure is deferred revenue of 6,904 million dollars, which is a backlog of future revenue rather than a debt in any economic sense. A reader who looked only at the headline liability figure would overstate the debt risk; a reader who looked only at the borrowing figure would understate the dilution risk. The score of minus 2 holds both corrections together, and it is the dilution, not the borrowing, that earns the deduction.
The second item, D2 on revenue quality, scores minus 1, a minor deduction that records a structural feature rather than a failure. There has been no accounting restatement, the auditor is Deloitte, and the internal-control opinion is effective, all confirmed from the annual filing, so there is no trigger for a larger deduction. The point of attention is the revenue recognition structure: most revenue is recognised over an average paying-user life of 27 months, an estimated figure as of June 2026, so the revenue reported in any quarter is a blend of bookings made over more than two years. The score file records a precedent that shows why this matters: a change in the estimated life from 28 months to 27 months in the second quarter of 2024 produced a one-time revenue increase of 92 million dollars for fiscal 2024, on a confirmed basis. An estimate change moving revenue by that amount is not evidence of manipulation, and the file does not suggest that it is, but it is evidence that the revenue figure is sensitive to an assumption. The deduction of minus 1 is the model's way of pricing that sensitivity without overstating it, and it is labelled as a no-trigger item in the sense that no restatement or control failure underlies it.
The third item, D3 on governance, scores minus 3, and it is the most structurally entrenched of the demerits. Founder David Baszucki holds 58.8 percent of total voting power, through 100 percent ownership of 47,070,464 Class B shares carrying 20 votes each, on a confirmed basis from the definitive proxy statement dated 16 April 2026. That is absolute control: external checks on management are limited by structure, not merely by practice, because no coalition of other shareholders can outvote the founder. The score file places this on an anchor line for calibration, between a peer at about 76 percent scoring minus 4 and a peer with founder voting power of 32.8 percent and a total demerit score of minus 2, which makes minus 3 a measured intermediate rather than an arbitrary figure. The offsetting factor is also recorded: the chief executive's salary is zero dollars, with compensation entirely in long-term equity, 75 percent of which is performance-conditioned. That aligns the founder's economic interest with long-term value creation, but it does not reverse the structural fact of control, and the score file is explicit that the offset does not overturn the deduction. Alignment of interest and concentration of power can coexist, and in this case they do.
The fourth item, D4 on regulatory and social cost, scores minus 4, and it is the largest single demerit and the score file's designated monitoring variable. Child-safety risk is becoming a realised cost rather than a hypothetical one. Legal settlement costs of 91 million dollars in the first six months of 2026 are confirmed from the quarterly filing. Three state attorney-general settlements are recorded on a press-reported basis: Nevada at more than 12 million dollars, Alabama at 12.2 million dollars, and West Virginia at 11.08 million dollars, with reform conditions covering age verification, parental controls, and restrictions on chat for minors. Beyond those settlements, a federal multidistrict litigation, MDL 3166 in the Northern District of California, has 148 cases pending with a settlement master appointed, on a press-reported basis, alongside a securities class action, a Florida attorney-general criminal investigation, and a Senate inquiry. The annual filing risk factors name Texas, Utah, and Louisiana app-store parental-consent laws and an Australian under-16 ban, showing that the regulatory pressure is geographically broad rather than confined to one jurisdiction. The score file's judgement is that costs are becoming recurring, which is why the deduction reaches minus 4 rather than stopping at a lower figure for isolated settlements. A cost that recurs is a different kind of risk from a cost that is paid once, because it changes the run-rate of the business rather than merely reducing a single period's result.
Beyond the four demerit items, the score file records concerns that sit beneath the triggers or outside them, and they deserve separate attention because they affect how the score should be read forward. Bookings deceleration, the fiscal 2026 bookings guidance range of 8 to 12 percent, and the ceiling that range implies for growth are the central commercial concern. Stock-based compensation at 19 to 23 percent of revenue is the central dilution concern. Founder control at 58.8 percent and the child-safety cost trend together form a governance-and-regulation axis totalling minus 7, which is the largest combined drag on the score. Slowing of the sign-up pipeline after the age-verification rollout and a decline in app-store ratings, both acknowledged by the company, show that the safety reforms carry a commercial cost as well as a legal one: the measures that strengthen institutional standing also friction the funnel through which new users arrive. The deferred-revenue structure, with its sensitivity to the 27-month life estimate, means that future estimate changes could move reported revenue without any change in underlying bookings. None of these concerns triggers an additional demerit under the frozen model, but together they describe the conditions under which the next scoring round could move, in either direction.
6. What to Watch: The Gap Between Attention and Monetisation
The score file's blitzscaling analysis names the current stage as a monetisation-mix transition, and that phrase is the best summary of what to watch. Users are still growing, hours are still growing, and the platform is still expanding geographically, with Japan and India growing at rates above 60 percent on a press-reported basis and the over-18 cohort in the United States showing daily active user and hours growth of 40 percent and spending growth of 50 percent, as recorded in the score file. What is not growing at the same pace is bookings per unit of attention. The viral titles of the second half of 2025 brought a surge of users; the evergreen titles toward which the mix has since shifted retain users but monetise each hour at a lower rate. The RFY algorithm's shift toward retention priority, noted in the score file, protects time spent while reducing spending per hour. Lower-monetising regions growing fastest compounds the effect: growth in the user base and growth in the revenue base are no longer the same thing, and the gap between them is the central analytical problem for the next scoring round.
The score file identifies the next quarter's bookings guidance range, 1,576 to 1,653 million dollars, as the point to watch for whether the guidance range is met, and it frames the algorithm's monetisation recovery as the mechanism to observe alongside it. That framing is deliberately narrow, and this assessment preserves its narrowness rather than broadening it into a forecast. Whether bookings re-accelerate toward the 30 percent range that would support a higher growth score, whether they remain in the high-single-digit range implied by the fiscal 2026 guidance, or whether they soften further, is a matter for the next quarter's reported results, not for speculation here. The third-quarter 2026 results, expected in early November on the score file's dating, fall after T and are therefore excluded from this assessment entirely; they belong to the next scoring round, where they will be measured against the guidance range and against the algorithm question rather than anticipated in advance.
Three further triggers from the score file structure the watchlist. First, the regulatory track: the pace at which settlement and legal costs become recurring, and the development of the federal multidistrict litigation with its 148 pending cases, will determine the next judgement on the regulatory demerit, which at minus 4 is already the largest single deduction. A stabilisation of those costs would relieve pressure on the score; an acceleration would deepen it. Second, the governance track is structural rather than event-driven: founder voting control of 58.8 percent does not change quarter by quarter, so the question is not whether it will move but whether any offsetting governance development, such as a change in the voting structure, emerges, and the score file records no such development at T. Third, the creator-economy track: Developer Exchange payments above 1.5 billion dollars per year are the financial expression of the moat, and their trajectory, together with the penetration of age verification beyond 57 percent and the performance of the artificial intelligence creation tools, will show whether the flywheel is strengthening or merely holding. The score file also proposes, as candidates for a future model version rather than as current scoring rules, a bookings-to-GAAP divergence indicator for the growth item, a stock-based-compensation dilution anchor for the debt item, a child-safety regulatory-cost anchor for the regulatory item, and a differential-voting anchor for the governance item, with Roblox as the anchor case for the latter three. Those proposals are recorded here because they show where the model itself recognises that Roblox exposes a measurement gap, not because they change the current score.
The overall picture, then, is a platform that has demonstrated the hardest part of blitzscaling, the replacement of an existing order by a creator-driven one, and that has demonstrated cash generation alongside that replacement, yet that sits one point below the threshold because the latest bookings evidence does not confirm that the replacement is still accelerating in monetisation terms. A score of 64, Grade B, with gates passed and no FLAG, is a precise statement of that position: strong enough in structure, in creative destruction at 12 of 15, and in cash generation to be taken seriously as a blitzscaling company, and not yet strong enough in the most recent bookings evidence, in market headroom at 7 of 12, or in the regulatory and governance deductions totalling minus 7, to cross the line the model sets. The next scoring round will not need a new theory to move the score. It will need bookings evidence, a regulatory cost trend, and a creator-economy trajectory, measured against the ranges and triggers the score file has already set out.
More Platforms companies
Other Platforms names on the Blitz Index, highest score first: Alphabet (83/A), Meta (78/B), Airbnb (76/B).
Next earnings
Q4 2026 · Expected
Coverage
Roblox Corporation · Q3 2026 due Oct 29, 2026 (AMC) · Score 64 · Grade B
Embed this score
Copy the HTML below to show this score on your site. The badge links back to this page and updates automatically when the score changes.
Preview:
BlitzLab scores businesses against a scholar’s standard — not investment advice. No price targets, no buy/sell recommendations. Figures are from SEC filings (XBRL) as labeled in the source scorecard.