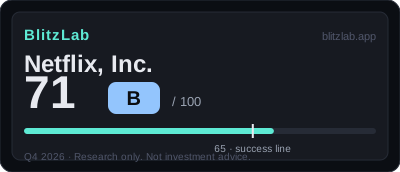
Netflix, Inc. — Blitz Index 71 (B)
Netflix scores 71 — the highest creative destruction in coverage, with a data flywheel, 7,000+ originals and $12B of free cash flow ahead, held back only by a gate that passes on the broad market definition alone.
Last re-scored: October 20, 2026.
Confidence: High · Category: platforms
Score breakdown
| Section | Score | Detail |
|---|---|---|
| A · Speed | 19 / 25 | Q3 revenue +11.8%, nine months +14.0%, FY2025 +15.6% at a $49.7B scale — decelerating (Q1 +16.2% → Q3 +11.8%) but still double digits, with FY2026 guidance of $51.1B (+13%) |
| B · Moat | 42 / 60 | A data flywheel plus 7,000+ exclusive originals (B1 12) and product distribution across 190+ countries (B2 13) at a 52.8% Q3 gross margin (B4 9) — the strongest moat in coverage |
| C · Creative destruction | 14 / 15 | DVD and linear TV displaced, on-demand viewing made irreversible — full marks on both, plus a second act in advertising and live (C1 5, C2 5, C3 4) |
| D · BlitzFailing | −4 | Net debt of ~$7.1B against ~$12B of expected FCF (D1 −1); a Brazil tax item distorting YoY margins (D2 −1); AI discovery layers and tax disputes as the watch items (D4 −2) |
Think we scored it wrong? Score it yourself →
Radar axes (0–100): Moat 70.0 · Speed 76.0 · Creative 93.3.
Watch item
Gates: G1 ✓ (confirmed — growth sustained plus a second curve: advertising at ~$2.7B for 2026 and live, games and partnerships) · G2 ✓ (estimated, borderline — SVOD alone FAILS; VOD plus advertising, games and live together clear the ~$497.3B bar about 2×). 6 points ABOVE the 65-point threshold — first score, and the 21st member of the 65+ Club. No FLAG: deductions of only 4. Watch: whether advertising and games prove to be independent markets rather than VOD extensions, and whether growth deceleration flattens.
Strengths
- Displacement complete: DVD and linear broadcast replaced, on-demand viewing irreversibly standardised, 190+ countries and ~330M households
- Moat: a data flywheel plus 7,000+ exclusive originals plus product distribution with a cost of acquisition near zero
- Margin expansion: Q3 operating margin of 34.6% (from 28.2%), FY outlook of 31.5%, free cash flow of ~$12B for FY2026
- Capital: a record $4.8B of Q3 buybacks, cash of $8.2B, net debt of only ~$7.1B
- Growth sustained: Q3 +11.8%, nine months +14%, FY guidance of $51.1B (+13%), churn improving and price rises absorbed
Concerns
- Growth decelerating: Q1 +16.2% → Q2 +13.4% → Q3 +11.8%, Q4 guidance of +11.5%
- Advertising outlook cut: $3.0B → $2.7B — advertising execution is lagging
- Borderline G2: the narrow SVOD definition FAILS and VOD alone would require a 69% share — advertising and games must prove out
- AI discovery layer: AI-native discovery rising above the app as a new intermediary (B1's long-term threat)
- Workforce cuts announced in Q3, Q4 margin guidance of 26.0% (cut costs of ~120bp)
Research notes
Thesis: the blitz is finished — the harvest has begun
Netflix enters the BlitzLab record with a first scoring of 71 out of 100, grade B, built from Speed 19 out of 25, Moat 42 out of 60, Creative Destruction 14 out of 15, and deductions of 4. The total sits 6 points above the 65-point line — the 21st member of the 65+ Club — and the shape of the score is the story: creative destruction converts to 93.3, the highest in coverage, speed to 76.0, and the moat to 70.0, the strongest moat in coverage. This is the streaming company — trailing-twelve-month revenue of about $49.7 billion — whose first act is complete: DVD and linear broadcast displaced, on-demand viewing made irreversible across 190 countries and roughly 330 million households, with 7,000-plus exclusive originals feeding a data flywheel. The second act is advertising, live events and games. The quarter shows the shift from speed to efficiency: revenue growth decelerated from 16.2% to 11.8% across the year, while the operating margin expanded to 34.6% and free cash flow reached $2.9 billion in the quarter.
The gates: both pass — the second only on the broad definition
Gate 1, sustained growth or a second growth curve for a mature company, passes on a confirmed basis. Revenue grew 15.6% in fiscal 2025 and 14.0% in nine months, and the second curve — advertising at about $2.7 billion for 2026, up $256 million year on year in the quarter — is already monetised. Gate 2, a ten-year market ceiling at least ten times current revenue, passes as an estimate, at the borderline, and the file says so plainly: on SVOD alone it FAILS, on VOD alone it would require a 69% share, and only the sum of VOD plus advertising, games and live — about $1.0 trillion extrapolated — clears the bar of about $497.3 billion by roughly two times. That is the weakest link in the 71: if advertising and games do not prove to be independent markets, the next quarter reopens the question. The fourth quarter of 2026 has not been reported at T, and its reporting date is unconfirmed — it is not a company-confirmed date and must not be presented as one — and no outcome is anticipated here. That is the balance of the record at T: a completed blitz, a harvest running at a 34.6% margin, and a market ceiling whose definition is the whole argument.
The business: subscriptions, advertising, and a second act
Netflix makes its money from streaming, and the mix is shifting. Subscription revenue still drives the business — of the $1,364 million year-on-year revenue increase in the third quarter, $1,057 million came from subscriptions — but advertising is now a second, monetised axis: about $2.7 billion is expected for 2026, up $256 million year on year in the quarter. Around that core sit live events, games, the TF1 integration in France and partnerships with Disney and Globo. The company reaches 190-plus countries and roughly 330 million households, with more than 7,000 exclusive originals. Fiscal 2025 revenue was $45,183 million, up 15.6%; the first nine months of 2026 brought $37,684 million, up 14.0%; the third quarter brought $12,874 million, up 11.8%. Guidance points to $51.1 billion for fiscal 2026, up 13%.
Why it scored 71: speed is decelerating, efficiency is rising
Speed scores 19 of 25. Growth (A1, 7 of 10) is still double-digit at $49.7 billion of trailing revenue, but decelerating: 16.2%, 13.4%, 11.8% across the first three quarters. The advertising outlook cut, from about $3.0 billion to $2.7 billion, confirms the slowdown. Capital speed (A2, 5 of 5) is the strongest item: third-quarter free cash flow of $2,884 million, up 8.4%, about $12.0 billion expected for fiscal 2026, and a record $4.8 billion of buybacks. Hiring (A3, 3 of 5) is the weak item: the 2026 headcount is undisclosed and the third quarter brought a workforce reduction. Share speed (A4, 4 of 5) rests on churn improving in every region, with Latin America up 17% and Asia-Pacific up 12%.
The moat scores 42 of 60. Network effects (B1, 12 of 18) run through a data flywheel — households, content investment, viewing data, personalised recommendations, retention — and through more than 7,000 exclusive originals. It stops short of the top band: this is not platform lock of the CUDA or iOS kind, and an AI-native discovery layer is rising above the app. Distribution (B2, 13 of 18) is near the top of its band because the product is the distribution: 190-plus countries, the app pre-installed on essentially every device, and a marketing bill of about 7% of revenue. The blemish is the delayed advertising rollout. Gross margin (B4, 9 of 12) is real but qualified: a 52.2% gross margin over nine months and a third-quarter operating margin of 34.6% against 28.2% a year earlier — qualified because part of the improvement is a $619 million Brazil tax item in the prior-year base.
Creative destruction scores 14 of 15, the highest conversion in coverage at 93.3. What is being displaced (C1, 5 of 5) is clear and large: DVD rental and linear broadcast giving way to streaming, with a second act now running — linear television advertising giving way to streaming advertising, traditional broadcast giving way to streamed live events. The behaviour change (C2, 5 of 5) is irreversible: on-demand viewing has no reason to return to a linear schedule. The cost-structure change (C3, 4 of 5) is incomplete: streaming collapsed the scheduling and transmission costs of linear broadcast, yet the content cost itself never collapsed.
The risks: four points of deductions, no FLAG
The deductions total 4, far below the 15-point FLAG line. Debt (D1, minus 1) is light: net debt of about $7.1 billion against free cash flow of about $12 billion expected for fiscal 2026; the open item is off-balance-sheet content commitments, undisclosed and estimated in the billions. Revenue quality (D2, minus 1) carries no restatement or auditor issue; the point reflects the $619 million Brazil tax cost in the prior-year base and advertising revenue recognition, which is not yet mature. Governance (D3, 0) is clean: no dual-class shares, co-chief executives Sarandos and Peters, Hastings as chair. Regulation (D4, minus 2) is the largest deduction: competition scrutiny, generative AI shaking copyright, and repeat country-level tax disputes — with no large fine or lawsuit materialised.
What would change the score
The score turns on the second act. If advertising and games prove to be independent markets rather than extensions of video on demand, the borderline gate verdict firms up; if they do not, the next quarter reopens the question. An advertising outlook recovering toward $3.0 billion would lift growth and distribution. Delivery of the fiscal 2026 guidance — $51.1 billion of revenue, a 31.5% operating margin, about $12 billion of free cash flow — is the test of the efficiency story. The longer watch item is the AI discovery layer: if it captures the viewer's entry point, the app risks becoming a content warehouse.
More Platforms companies
Other Platforms names on the Blitz Index, highest score first: Alphabet (83/A), Meta (78/B), Airbnb (76/B).
Next earnings
Q4 2026 · Expected
Coverage
Netflix, Inc. · Next earnings unconfirmed at scoring · Score 71 · Grade B
Embed this score
Copy the HTML below to show this score on your site. The badge links back to this page and updates automatically when the score changes.
Preview:
BlitzLab scores businesses against a scholar’s standard — not investment advice. No price targets, no buy/sell recommendations. Figures are from SEC filings (XBRL) as labeled in the source scorecard.