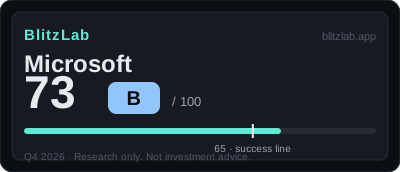
Microsoft — Blitz Index 73 (B)
The decelerating giant re-accelerated on AI — Azure +41% and a $37B AI run-rate — while capex at 35% of revenue quietly compresses the free cash flow that funds it.
Last re-scored: October 28, 2026.
Confidence: High · Category: platforms
Score breakdown
| Section | Score | Detail |
|---|---|---|
| A · Speed | 18 / 25 | Revenue re-accelerated to +17.8% at $331.8B scale; Azure +41% with Q4 at +43% — real speed, capped by sheer size |
| B · Moat | 48 / 60 | Installed base + workload gravity + distribution (Windows · M365 · GitHub · LinkedIn): a composite lock-in, the deepest in the index after Alphabet |
| C · Creative destruction | 10 / 15 | Copilot paid seats passed 30M and work is being delegated to AI — the behavior change is real but early against a base of hundreds of millions |
| D · BlitzFailing | −3 | Light demerits (−3): antitrust scrutiny and the OpenAI structure. The watch item is capex discipline, not governance |
Think we scored it wrong? Score it yourself →
Radar axes (0–100): Moat 80 · Speed 72 · Creative 66.7.
Watch item
Gates: G1 ✓ · G2 ✓ (estimate — as the largest player, the ceiling is the market's own growth). Bar ≈ $3.32T (FY2026 revenue × 10) vs single-year global AI spend of ~$2.67T (2026E) and still growing.
Strengths
- Azure +41% for FY2026, accelerating into Q4 (+43%); Azure revenue passed $100B for the first time
- Commercial RPO $678B (+84%) — contracted demand visibility no peer matches
- AI business run-rate $37B (+123% YoY); M365 Copilot paid seats 30M+
- Operating cash flow $182.9B (+34%) funds the build-out without leverage
Concerns
- Cash capex $115.9B = 34.9% of revenue, while FCF fell two straight years ($74.1B → $67.0B)
- Azure is growing at roughly the cloud market's pace — share is being held, not taken
- Copilot has no disclosed standalone ARR — AI monetization cannot be separated from the bundle
- OpenAI entanglement: ~25% as-converted stake; $24.1B of FY2026 revenue was OpenAI-related
Research notes
1. Current Position: A Second Blitz Whose Substitution Is Already Complete
Microsoft Corporation enters this scoring period as a mature company in the middle of a second blitz, and the most important thing to understand about that position is how far along it already is. The classic blitzscaling story is a young company racing to seize a new market before competitors can react. Microsoft's story in 2026 is the opposite shape: a company that already owned the old order, spent a decade building its replacement, and now finds the replacement larger than the business it replaced. Fiscal 2026 revenue reached $331,839 million, up 17.8 percent on the prior year, after two years in which growth had settled at 14.9 percent in both fiscal 2024 and fiscal 2025. That re-acceleration at a scale above $300 billion is the central fact of this score, and it is what carries the company through both gates of the BlitzLab model. Gate 1, which asks whether growth continues or a second growth curve exists, passes on confirmed figures. Gate 2, which asks whether the ten-year ceiling of the new market is at least ten times current revenue, passes on an estimate: ten times fiscal 2026 revenue sets a bar of approximately $3.32 trillion, and the combination of forecast global artificial intelligence spending, cloud infrastructure, and enterprise software and productivity markets is judged capable of reaching it.
The shape of the substitution matters as much as its size. Microsoft Cloud generated $214.4 billion in fiscal 2026, up 27 percent, accounting for 65 percent of total company revenue. Azure, the engine inside that total, grew 41 percent for the full year, accelerating through the quarters from 40 percent to 39 percent to 40 percent and then 43 percent in the fourth quarter, and passed $100 billion in annual revenue for the first time. Server products, the on-premises business that cloud computing was supposed to displace, grew only 1 percent over the same period. That contrast is the substitution made visible in the income statement: the old order is not being defended against an outside attacker, it is being steadily cannibalized by the company's own replacement, and the replacement has already become the majority of the business. The first curve has not collapsed, either. Productivity and Business Processes, the segment that carries the Office and Microsoft 365 franchises, reached $140.0 billion, up 15.9 percent, with segment operating profit of $83.9 billion, while Intelligent Cloud reached $137,791 million, up 29.7 percent, with segment operating profit of $57.0 billion. Microsoft is therefore not caught between blitzes, waiting for a second curve to arrive. It is in the rarer condition in which two curves overlap and the center of gravity has already moved: the first curve still grows and still supplies fuel, while the second curve is already the body of the company. The remaining questions are no longer about whether the second curve exists, but about how long its slope can be sustained and when the enormous capital spending behind it begins to return cash.
That distinction explains why the score is a B rather than an A, and why it sits eight points above the 65-point threshold that BlitzLab treats as success. A score of 73 describes a company whose moat is deep and whose economics are among the strongest of any large company, but whose speed is the speed of a giant re-accelerating rather than a challenger exploding, and whose creative destruction is substantially a completed transition rather than a fresh one. The comparison anchor in the score file, Alphabet at 83/A, makes the gap legible: Microsoft trails by three points on speed, four on moat, and five on creative destruction, partly offset by two points fewer in demerits. Every point of that ten-point gap, on the score file's own accounting, traces back to a single theme: the directness of the moat in the artificial intelligence era. Microsoft's advantages are real and large, but they operate through installed base, distribution, and workload gravity rather than through a self-reinforcing data flywheel, and a substantial part of its flagship artificial intelligence differentiation arrives through a partner's intellectual property rather than its own.
2. Speed: Re-acceleration at Giant Scale, Bought With Its Own Cash
Speed scores 18 out of 25, and the composition of that subscore tells the story of a mature company choosing how fast to run. Growth itself earns 8 out of 10. Fiscal 2026 revenue growth of 17.8 percent, with quarterly growth of 18.4 percent, 16.7 percent, 18.3 percent, and 17.7 percent across the four quarters, is a genuine re-acceleration from the 14.9 percent plateau of the two prior years, achieved at a revenue base above $300 billion. The discount from a higher mark reflects two things the score file records plainly: the acceleration, while real, is narrower than Alphabet's comparable acceleration, and More Personal Computing, the segment carrying Windows consumer and devices businesses including Xbox, declined 1.1 percent, acting as a drag on the total. A further limit on verification applies to the artificial intelligence story itself. The artificial intelligence business reached an annual run rate of $37 billion, up 123 percent year on year as of the third quarter of fiscal 2026, and paid Microsoft 365 Copilot seats passed 30 million, but Copilot's standalone annual recurring revenue is not separately disclosed. The monetization of artificial intelligence can therefore be measured in aggregate and in seat counts, but not yet separated and verified product by product, and the score reflects that limit rather than looking past it.
Capital velocity earns 4 out of 5, and here Microsoft's position is unusual in a way that deserves emphasis. Cash capital expenditure rose from $44,477 million in fiscal 2024 to $64,551 million in fiscal 2025 and then to $115,948 million in fiscal 2026, an increase of 79.6 percent in a single year, taking capital expenditure from 18.1 percent of revenue to 22.9 percent and then to 34.9 percent. That spending was funded from operating cash flow of $182,935 million, up 34 percent, rather than from borrowing, and the company's access to capital at an estimated market capitalization of around $3.0 trillion is of the highest order. The discount from the top mark is a matter of concentration rather than capacity: the score file notes that Microsoft's capital deployment, while at the highest level of speed, does not match the concentration of a peer combining very large external debt issuance with capital expenditure guidance approaching half of revenue, and Microsoft simultaneously directed roughly $22.3 billion to share repurchases and $27,034 million to dividends. Capital, in other words, is being split between the blitz and shareholder returns. That split is a choice with two faces. It demonstrates that the company can fund a historic investment program from its own cash generation without leverage, and it also means the blitz is not being pursued with the single-minded concentration that the blitzscaling playbook, in its purest form, would demand.
The two remaining speed items pull in opposite directions and together describe a company getting more productive while shrinking slightly. Hiring and productivity earn 3 out of 5: headcount fell from 228,000 at June 30, 2025 to 223,000 at June 30, 2026, a decline of 2.2 percent, composed of 77,000 in research and development, 89,000 in operations, 43,000 in sales and marketing, and 14,000 in general and administrative roles. Revenue per employee, calculated from those figures, is approximately $1.49 million, which is healthy by mega-capitalization standards but a tier below the comparable figures the score file cites for Alphabet and Meta. This is not a hiring blitz; it is a productivity improvement phase conducted while headcount contracts, and it is scored as such. Share velocity earns 3 out of 5 on similar logic. Azure's share of cloud infrastructure stood at approximately 20 percent in the second quarter of 2026 on Synergy Research figures reported in the press, against approximately 28 percent for Amazon Web Services and 15 percent for Google Cloud, holding second place. But Azure's growth of 41 to 43 percent roughly matches the cloud infrastructure market's own growth of approximately 43 percent on a trailing-twelve-month basis, which reads as share maintenance rather than share gain, and commercial Microsoft 365 seat growth of 6 percent is modest. Paid Copilot seats above 30 million are evidence of a new category taking hold, but without a disclosed denominator for that category's market, they cannot be converted into a share-gain claim. Speed, in sum, is the subscore of a company running fast in absolute terms and holding its ground in relative ones.
3. Moat: Installed-Base Gravity, Not Network Effects
Moat scores 48 out of 60, the strongest of the three axes in absolute terms, and its internal structure is the most instructive part of this assessment. Network effects earn 12 out of 18, and the reasoning behind that mark corrects a common misunderstanding about Microsoft. The company does not, for the most part, possess the classic direct network effect in which each additional user structurally increases the value of the product for every other user, the way additional search queries improve search quality for everyone. What it possesses instead is a compound lock-in built from installed base, workload and data gravity, and distribution: Windows, Microsoft 365, GitHub, and LinkedIn reinforcing one another. LinkedIn revenue of $19,817 million, up 11 percent, represents a genuine two-sided professional graph, and GitHub's developer ecosystem, Azure's consumption-based billing, and Microsoft 365 seat lock-in mutually reinforce each other. The company also holds usage rights to OpenAI intellectual property, models and infrastructure, as stated in its annual report. The score file places this in the 10 to 14 band for conversion-cost and ecosystem lock-in moats, at the same level as Oracle's database lock-in, and three points below Alphabet, precisely because the moat's essence is installed-base gravity rather than a network effect. That is not a criticism of the moat's strength; it is a classification of its mechanism, and the classification matters because gravity defends differently than a flywheel grows. Gravity holds customers in place and makes departure expensive. A flywheel makes the product better as it grows. Microsoft has the former in abundance and the latter only in pockets.
Distribution scalability earns 14 out of 18, the highest moat item, and here the installed base becomes an offensive weapon rather than a defensive one. Microsoft owns its distribution assets rather than renting them: Windows through original equipment manufacturers, Microsoft 365 through bundling, the Azure marketplace, and GitHub. New artificial intelligence features, above all Copilot, can be deployed immediately onto an existing base of hundreds of millions of seats and personal computers, and the passage of paid Copilot seats beyond 30 million is the empirical demonstration of that mechanism working. Sales and marketing expense of $26,710 million, equal to 8.0 percent of revenue, provides the quantitative evidence of distribution leverage: a company of this scale spending less than a tenth of revenue on sales and marketing is, in effect, letting its installed base do much of the selling. The two-point gap to Alphabet reflects a real difference in kind. Alphabet distributes free consumer products globally at approximately zero customer acquisition cost, the product itself being the distribution channel. Microsoft's distribution combines paid enterprise seat upselling with direct Azure sales, which means the base to be climbed onto is enormous but the product does not spread virally on its own. The distinction is worth holding onto, because it shapes what Microsoft's artificial intelligence adoption curve can look like: fast within the base it already owns, and dependent on enterprise selling motion beyond it.
Market size earns 10 out of 12, and gross margin earns 11 out of 12, and together they complete the moat picture. The market-size mark follows from Gate 2: the ten-year ceiling is judged reachable when forecast global artificial intelligence spending of $2.67 trillion for 2026 on Gartner figures reported in the press, cloud infrastructure of approximately $500 billion on a trailing-twelve-month basis growing at 43 percent on Synergy figures reported in the press, and enterprise software and productivity markets are combined. The score is withheld from the maximum for the same reason it is withheld for Alphabet, because the ceiling remains at the estimate stage, and the score file adds a stronger reservation for Microsoft: as the largest occupant of each of these markets already, Microsoft's path to the ceiling depends on the markets themselves growing rather than on taking share from others, and its estimated market capitalization of around $3.0 trillion already represents approximately 91 percent of the $3.32 trillion bar. Gross margin, at 67.9 percent on gross profit of $225,465 million, with an operating margin of 46.8 percent that actually rose from 44.6 percent to 45.6 percent and then 46.8 percent over three years, is among the best profit structures of any mega-capitalization company, and it earns the same 11 points awarded to peers with very different margin levels. The withheld twelfth point records the direction of travel: gross margin has fallen for two consecutive years, from 69.8 percent to 68.8 percent to 67.9 percent, with Microsoft Cloud gross margin at 66 percent, as artificial intelligence infrastructure investment and usage costs press against the margin even while operating leverage lifts the operating margin. The level is superb; the direction is adverse; the score holds both facts at once.
4. Creative Destruction: The Old Order, Displaced From Within
Creative destruction scores 10 out of 15, and its three items trace a company at different stages of three different destructions. The order being displaced earns 4 out of 5. The transition from on-premises servers and perpetual licenses to consumption-based cloud and artificial intelligence inference is being led by Microsoft displacing its own product lines: server products grew only 1 percent while Azure grew 41 percent and Microsoft Cloud reached 65 percent of revenue. That is self-cannibalization executed at scale, and it is the hardest form of creative destruction to carry out, because it requires a company to shrink the business that made it dominant in order to grow the business that will replace it. The second half of the item concerns the next displacement, from seat-based software-as-a-service to agent-based work units, in which Microsoft 365 Copilot and agents would change both how work is charged for and how work itself is organized. The score file is careful here: this agent transition is described in the company's strategy disclosures but lacks separated revenue disclosure, so it is scored as a management claim rather than demonstrated fact, one point below Alphabet, whose displacement of its own search results page with artificial intelligence answers is underway at a scale of more than 2.5 billion users. Microsoft's cloud displacement is complete and mature; its agent displacement is asserted and early. The mark of 4 reflects that split.
Irreversible behavior change earns 3 out of 5, and the score file applies the anchor table's own example directly: artificial intelligence coding assistants, including Copilot, represent behavior change in progress, which the anchor table scores at 3. The evidence for movement is substantial: paid Copilot seats above 30 million across GitHub and Microsoft 365, an artificial intelligence annual run rate up 123 percent, and commercial remaining performance obligations of $678 billion, up 84 percent, indicating that customers are committing to future consumption at a rapidly thickening rate. What keeps the mark at the middle of the scale is penetration: 30 million paid seats, however impressive in absolute terms, remain early relative to a seat base measured in the hundreds of millions, and the lock-in of cloud migration, while irreversible in practice, is an infrastructure transition rather than the creation of a new behavior. Alphabet's five points, by contrast, rest on having created an irreversible behavior in the first place and now leading its conversion to a new form. Microsoft's artificial intelligence behavior change is underway, visible in numbers, and not yet pervasive, and the score says exactly that.
Cost structure change earns 3 out of 5 on a similar balance of real change and missing measurement. The structural change is genuine: consumption-based cloud has moved customer information technology spending from perpetual licenses and owned equipment, which is capital expenditure, to usage-based billing, which is operating expenditure, and Azure's passage beyond $100 billion is the scale at which that change can be called structural rather than experimental. The discounts are twofold. First, no quantitative measurement of unit-cost decline appears in the score file's evidence, and under the site's conservative principle an estimated item is scored one band lower. Second, Microsoft's own cost structure is expanding rather than contracting, with cash capital expenditure at 34.9 percent of revenue and gross margin falling. Alphabet's one-point advantage rests on a quantified claim about its own vertically integrated silicon reducing inference unit costs; Microsoft's score file contains no corresponding demonstration for its own silicon or unit costs, and the model layer depends on OpenAI intellectual property. The creative destruction subscore, taken as a whole, therefore describes a company that has already destroyed its old order, is in the middle of changing user behavior, and has changed its customers' cost structure without yet demonstrating a falling unit cost of its own.
5. Deductions and Risks: Two Bills, Both Visible
Demerits total only −3, and the smallness of that number is itself informative: it says that none of the classic sources of fragility, debt distress, governance concentration, or major regulatory sanction, currently applies with force to Microsoft. But the composition of the −3 matters more than its size, because it isolates the two live risks. Debt earns 0. Total borrowings stood at $40,294 million at June 30, 2026, down from $43,151 million a year earlier, against cash and short-term investments of $76.8 billion, leaving the company in a net cash position, and stock-based compensation of $12,405 million, equal to 3.7 percent of revenue, is low. The score file explicitly refuses to treat the capital expenditure surge as a debt item: cash capital expenditure of $115.9 billion and two consecutive years of declining free cash flow are recorded as a capital-intensity question for a future version of the model, not as a demerit under the current one, following the same treatment given to Alphabet. Governance also earns 0. Microsoft has a single-class share structure with no dual-class voting rights and no founder voting control, under professional management, with its largest holders being institutions: Vanguard at 8.95 percent and BlackRock at 7.30 percent. Among the giants, the score file calls this the cleanest governance structure, in direct contrast to founder voting control at its peers. These two zeroes are the ballast of the score: whatever risks Microsoft faces, they are not the risks of a levered balance sheet or a captured board.
The two demerits that do apply are where the analysis concentrates. Revenue quality earns −2, and its cause is structural rather than accounting-related: there is no revenue restatement or audit issue, and the deduction rests entirely on dependence on OpenAI. Microsoft holds an equity-method stake of approximately 25 percent on an as-converted basis, has deployed $11.9 billion of approximately $13.0 billion in cumulative commitments, and recorded $24.1 billion in OpenAI-related revenue in fiscal 2026, equal to 7.3 percent of total company revenue, alongside $6.0 billion in OpenAI trade receivables, measured under the hypothetical liquidation at book value method. The quality concern sharpens when the earnings statement is examined: equity-method results swung from a pre-tax loss of $4.76 billion in fiscal 2025 to pre-tax income of $6.53 billion in fiscal 2026, and fiscal 2026 GAAP net income growth of 31 percent includes after-tax valuation gains of $5.0 billion from OpenAI and $3.2 billion from Anthropic, against adjusted net income of $128.8 billion, up 22 percent, which the score file treats as the underlying trajectory. The deduction is limited to −2 precisely because all of this is fully disclosed and an adjusted figure is published alongside the GAAP figure; the concern is not concealment but structure, since the source of flagship artificial intelligence differentiation and a material slice of reported profit both sit outside the company's full control. Regulation and social cost earn −1, and its cause is specific and bounded: a LinkedIn matter under European data protection law, in which the Irish Data Protection Commission's fining decision of October 2024 is under appeal, with a preliminary hearing in December 2025, a legal provision of $553 million booked, and a reasonably possible additional loss of approximately $400 million disclosed. A concrete provision exists, so the item cannot be zero, but the score file records no material antitrust judgment or structural remedy against Microsoft in the annual report, making this qualitatively lighter than the regulatory burdens carried by its peers. Xbox impairments, severance costs, and the More Personal Computing decline are explicitly not counted here, because they are business results rather than regulatory costs, and the score keeps those categories separate.
Stepping back from the item scores, the risk picture resolves into the score file's own framing: there are two bills attached to this second blitz. The first is the capital bill. Cash capital expenditure of $115.9 billion, or 34.9 percent of revenue, against free cash flow that has fallen from $74.1 billion to $71.6 billion and then to $67.0 billion over two years, is sustainable only while operating cash flow of $182.9 billion and an operating margin of 46.8 percent keep rising, and the annual report itself states the uncertainty about when and at what level advance investment converts into revenue. The second is the partner bill. Flagship artificial intelligence differentiation depends on OpenAI intellectual property, related revenue of 7.3 percent, receivables of $6.0 billion, and equity-method swings measured in billions, while the infrastructure cost of serving that demand has been converted into the company's own fixed costs through data center spending. If the partner's model competitiveness or contractual structure changes, differentiation weakens while depreciation and data center fixed costs remain. That asymmetry, between an external variable and an internal fixed cost, is identified in the score file as the single largest failure point of this second blitz, and it is the risk that a reader of this assessment should carry forward most seriously. Neither bill currently threatens the score, because the balance sheet is net cash and the governance is clean, but both bills define what would have to go wrong for the score to fall.
6. What to Watch
Several observable markers will determine whether this 73/B rises, stays level, or falls, and each of them is already named in the score file's evidence. The first is the persistence of Azure's growth rate in the low forties. Azure accelerated to 43 percent in the fourth quarter of fiscal 2026 after three quarters at 40, 39, and 40 percent; whether that rate holds, fades toward the market rate, or re-accelerates further will decide whether the growth item can move above 8 and whether share maintenance turns into share gain. The second is the conversion of capital expenditure into cash. Free cash flow has declined for two consecutive years while capital expenditure has nearly tripled since fiscal 2024; the reversal of that pattern, or its continued deterioration, is the most direct test of whether the second blitz is paying for itself, and it is a test the current model records only as a candidate for a future version rather than as a scored item, which makes independent observation of it more rather than less important. The third is disclosure. Copilot's standalone annual recurring revenue is not published, and the agent-based transition from seat pricing to work-unit pricing has no separated revenue evidence; either disclosure would convert a management claim into a verifiable fact and could move the creative destruction items. The fourth is the OpenAI structure itself: the size of related revenue relative to the company total, the receivables balance, and the direction of equity-method results will show, quarter by quarter, whether dependence is deepening or diluting as Microsoft's own artificial intelligence revenue grows. The fifth is margin direction. Gross margin has fallen from 69.8 percent to 67.9 percent over two years while the operating margin has risen; the twelfth moat point, previously withheld, was awarded (B4 now 12 of 12) after total gross margin held at 68 percent in fiscal 2027 first-quarter results and the operating margin widened to 49.8 percent, and the question going forward is whether operating leverage can continue to offset any renewed decline.
Two further watch items sit outside the score but inside the reader's judgment. The fiscal 2027 first-quarter results, due October 28, 2026, fall after this assessment's as-of date of October 20, 2026 and are therefore excluded from the score; they will be the first new evidence on every marker above, and they should be read against the fiscal 2026 baseline recorded here rather than against expectations formed after the fact. And the valuation note, which the model deliberately excludes from the score, records an estimated market capitalization of around $3.0 trillion and a price-to-sales ratio of approximately 9.0 times fiscal 2026 revenue, with the market capitalization already at approximately 91 percent of the $3.32 trillion Gate 2 bar. The business score does not look at price, following the lesson of BlitzLab's earlier testing that a business score and a market price measure different things, but a reader who cares about the distance between a business ceiling and a price that already reflects most of it will find that figure here, labeled as an estimate and kept separate from the score. Microsoft at 73/B is, in the end, a portrait of a completed substitution still accelerating: a company that has already replaced its own core business, that is funding an enormous second investment cycle from its own cash, that defends itself with gravity rather than a flywheel, and whose future depends less on whether its second curve exists than on how long its slope lasts, when its capital spending returns cash, and whether the differentiation it rents remains as strong as the infrastructure it owns.
More Platforms companies
Other Platforms names on the Blitz Index, highest score first: Alphabet (83/A), Meta (78/B), Airbnb (76/B).
Next earnings
Q4 2026 · Expected
Coverage
Microsoft Corporation · Q1 FY2027 due Oct 28, 2026 (AMC, confirmed) · Score 73 · Grade B
Embed this score
Copy the HTML below to show this score on your site. The badge links back to this page and updates automatically when the score changes.
Preview:
BlitzLab scores businesses against a scholar’s standard — not investment advice. No price targets, no buy/sell recommendations. Figures are from SEC filings (XBRL) as labeled in the source scorecard.