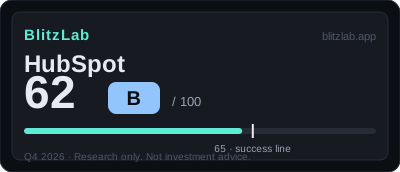
HubSpot — Blitz Index 62 (B)
PLG distribution and multi-hub lock-in are real, but decelerating growth and an unquantified AI curve stop it 3 points short of the line.
Last re-scored: October 20, 2026.
Confidence: High · Category: platforms
Score breakdown
| Section | Score | Detail |
|---|---|---|
| A · Speed | 15 / 25 | 1H 2026 growth +21.5% with guidance reaffirmed — but the trajectory decelerates (33% → 19%); NRR 103.5% is the weak gear |
| B · Moat | 38 / 60 | Multi-hub lock-in: 70% of installed ARR sits on 3+ products; PLG distribution — Breeze AI revenue still undisclosed |
| C · Creative destruction | 9 / 15 | Killing its own seat-based model with agentic pricing — self-destruction announced, not yet visible in revenue |
| D · BlitzFailing | 0 | No debt, single share class, buybacks shrink the share count — a zero-demerit file |
Think we scored it wrong? Score it yourself →
Radar axes (0–100): Moat 63.3 · Speed 60 · Creative 60.
Watch item
Gates: G1 ✓ · G2 ✓ (estimate — the company discloses no quantified TAM). Bar ≈ $34.5B (TTM revenue × 10) vs a ~$100B+ core CRM market.
Strengths
- 1H 2026 +21.5% — 20%-range growth held inside a decelerating trajectory; FY2026 guidance (+18%) reaffirmed Oct 1
- Multi-hub proof: customers on 3+ hubs are 70% of installed ARR; $120K+ ARR deals +38% YoY
- Gross margin 83.8% and first GAAP profit (+$7.4M FY2025, $43.3M in Q2 2026); non-GAAP FCF $594.9M
- Zero convertibles and buybacks cut the share count 5.5% in six months — dilution more than offset
Concerns
- Deceleration: 33% → 25% → 21% → 19%, with Q3 2026 guidance at +14% — low-teens growth is next year's risk
- NRR 103.5% (new formula; ~102% in Q2 2026) — a weak expansion engine next to low-120s platform peers
- Breeze AI revenue is nowhere quantified — the AI transition cannot yet be verified in numbers
- The ~7% restructuring (Oct 1) reads both as AI leverage and as cost defense against slower growth
Research notes
1. Current Position: A Graduated Blitzer Waiting for Verification
HubSpot enters this scoring period in a position that is easy to misread if only the headline number is seen. A score of 62 out of 100, grade B, sits three points below the 65-point threshold that BlitzLab treats as success, and that shortfall invites a simple reading: a company that has fallen short. The score file tells a more precise story. HubSpot is classified as mature, on trailing-twelve-month revenue of approximately $3.45 billion, and it passes both gates of the BlitzLab model. Gate 1, which asks whether growth continues or a second growth curve exists, passes on confirmed figures. Gate 2, which asks whether the ten-year ceiling of the new market is at least ten times current revenue, passes on an estimate. The company is therefore not excluded at the gate stage, and it is not penalised in the demerit section at all: deductions total zero. What keeps it below 65 is not a failure that has already happened, but a set of proofs that have not yet arrived in numerical form. The score file's own summary phrase for this position is "verification waiting" — the materials for a renewed acceleration appear to be assembled, and the verdict depends on the numbers of the next two quarters.
That framing matters because HubSpot's history, as recorded in the score file, is the history of a company that has already completed the first blitz and settled into a different kind of contest. The first substitution — fragmented point tools and expensive enterprise customer relationship management software giving way to an integrated platform for the mid-market — is described as substantially complete. Revenue has grown from a base that once compounded above 30 percent to a mature software business growing at around 20 percent, with 306,446 customers as of the second quarter of 2026, up 14 percent year on year, spread across more than 135 countries, and with subscription revenue accounting for 98 percent of the total. The contest now is not whether product-market fit exists. It is whether two re-ignition tasks can succeed: moving further upmarket, where larger deals are already growing quickly, and converting artificial intelligence agents from usage indicators into a second revenue curve with a price structure of their own. Neither task has yet produced the figure that would settle it, and the score of 62 reflects that suspension with unusual clarity. Every point of the three-point gap to the threshold, on the score file's accounting, traces to items explicitly labelled as awaiting numerical confirmation: agent revenue that is not yet quantified, an expansion rate that has not yet rebounded, and a restructuring whose productivity effect has not yet been measured.
The comparison anchor in the score file sharpens the picture. Salesforce, scored at 65/B in the same 2026Q4 period, is the direct comparison in the same customer relationship management category, at a different scale and with a different moat. HubSpot matches Salesforce on several moat and creative-destruction items, and exceeds it on speed, yet finishes three points behind overall. The difference is not a single weakness but the shape of the moat: Salesforce's ecosystem is an order of magnitude larger, while HubSpot's lock-in is demonstrated inside its own installed base rather than across an open marketplace. Understanding HubSpot therefore requires holding two facts together that pull in opposite directions. Inside the base, the platform grip is strong and measurable. Across the market, the expansion engine is ordinary, and the newest growth story is still told in usage counts rather than in revenue.
The as-of discipline of this assessment is part of its meaning. The latest results included are for the second quarter of 2026, announced on 2026-08-05. Third-quarter 2026 results, expected in November 2026, fall after the as-of date of 2026-10-20 and are excluded. That exclusion is not a technicality. It is what makes the restructuring announced on 2026-10-01, affecting approximately 7 percent of the workforce, a declared action rather than a measured result in this score, and it is what makes the agent pricing pilot launched in September 2026 a beginning rather than an outcome. A reader who wants to know whether HubSpot crosses 65 should therefore read this assessment as a baseline drawn on 2026-10-20, against which later quarters can be judged, rather than as a judgment that already contains those quarters.
2. Speed: Still Fast in Absolute Terms, Decelerating in Trajectory
Speed scores 15 out of 25, the highest of the three axes relative to its maximum after moat, and it is also the subscore where the tension between level and direction is sharpest. The score file states the tension plainly in its first key driver: speed is among the upper tier of comparable software companies, but the direction of travel is deceleration. Growth itself earns 6 out of 10. Fiscal 2025 revenue reached $3,131.3 million, up 19.2 percent on confirmed Securities and Exchange Commission figures, and the first half of 2026 reached $1,792.7 million, up 21.5 percent. The quarterly path inside that half shows first-quarter 2026 growth of 23 percent, or 18 percent in constant currency, and second-quarter growth of 20 percent, or 17 percent in constant currency. Full-year 2026 guidance of $3.678 billion to $3.686 billion, up 18 percent, or 16 percent in constant currency, was reaffirmed in the 8-K of 2026-10-01. Those are the figures of a business still growing at around one-fifth per year at a revenue base above $3 billion, and they are why the growth item is not scored lower.
The discount from a higher mark comes from the trajectory that surrounds those figures. Annual growth has decelerated for four consecutive years on confirmed figures: 33.1 percent in fiscal 2022, then 25.4 percent, then 21.1 percent, then 19.2 percent in fiscal 2025. Guidance for the third quarter of 2026 points to growth of 14 percent, or 15 percent in constant currency, which would be the next step down that staircase if realised. The score file is careful to note that the 6 points for growth describe the speed of the present, not the speed of the trajectory, and that distinction is the whole of the growth judgment. A company growing at 20 percent with a guidance path pointing toward the mid-teens is in a different position from a company growing at 20 percent with guidance pointing upward, even though a single quarter's figure looks the same. The comparison recorded in the score file makes the calibration explicit: ServiceNow, growing at 24 percent, receives the same 6 points, because its larger scale offsets its faster rate, while the deceleration and the guidance outlook offset HubSpot's smaller scale. Speed, in this model, is never a single growth rate read in isolation. It is a rate, a base, a trajectory, and a forward guide read together.
Capital velocity earns 3 out of 5, and its character is the opposite of a young blitz company raising money to fund expansion. HubSpot's capital story in this period is one of return rather than raising. The balance of convertible notes stands at zero, confirmed, following completion of the conversion of the 2025 notes. Share repurchases totalled $500.0 million in fiscal 2025, plus $211.0 million in the first quarter of 2026 and $531.9 million in the second quarter, and a new $1.0 billion repurchase programme was approved on 2026-08-03. The effect on the share count is large and fast: shares outstanding fell from 52.6 million to 49.7 million in six months, a decline of 5.5 percent. Against a market capitalisation of approximately $11.0 billion as of 2026-10-02, on a press-reported basis, that pace of repurchase is substantial, and the score file places it at the same level as Salesforce at 3 points. The withheld marks reflect a limit that the score file states directly: the test of doubling market capitalisation within twelve months is not met, with a 52-week range of $169.63 to $503 on a press-reported basis. Capital is therefore moving quickly, but it is moving inward, shrinking the share count, rather than outward into a market expansion that doubles value in a year. That is the capital pattern of a mature company, and it is scored as such.
Hiring and productivity earn 2 out of 5, the weakest speed item, and here the evidence is a near-standstill followed by a declared break. Headcount moved from 8,882 employees at the end of 2025 to 9,016 at 2026-06-30, an increase of only 1.5 percent in half a year. Hiring, in other words, had effectively stopped before the restructuring was announced. Revenue per employee, calculated from the score file's figures, stood at approximately $353,000 for fiscal 2025 and approximately $383,000 on a trailing-twelve-month basis, below the comparable figures cited for Salesforce at $527,000 and ServiceNow at $508,000, and far below the model's $1 million reference level. The restructuring announced on 2026-10-01, affecting approximately 7 percent of the workforce, or roughly 660 people, described by the company with the phrase "flatter, faster," together with the 2030 goals of a 30 percent non-GAAP operating margin and a 20 percent GAAP operating margin, is presented in the score file as a declaration of productivity improvement rather than a measured one. At the as-of date, no post-restructuring productivity figure exists to score, so the item remains at the same 2 points as Salesforce. The restructuring is thus doubly important for the future of this score: it is both the cost of the transition and the test of whether the transition produces a leaner company, and neither side of that equation can be judged until later quarters report headcount and revenue per employee after the change.
Share velocity earns 4 out of 5, the strongest speed item after growth, and it is where HubSpot's upmarket movement becomes quantitative. Customers numbered 306,446, up 14 percent, on confirmed figures, and the composition of that growth matters more than the total. Deals with annual recurring revenue above $120,000 grew 38 percent year on year on a press-reported basis and now represent 18 percent of installed annual recurring revenue. Customers using three or more hubs account for 70 percent of installed annual recurring revenue, while single-hub customers account for only 9 percent. That pattern is the quantitative footprint of wallet share expanding inside existing accounts: the company is not only adding logos, it is deepening its position within the accounts it already serves, and the larger deals are growing far faster than the customer count as a whole. The point withheld from the maximum reflects three discounts recorded in the score file. Customer growth itself has slowed, from 17 percent to 14 percent. Average revenue per customer, measured as average subscription revenue per customer, grew only 3 to 6 percent. And no quantified market share figure is confirmed, so a claim to be taking share of the overall market, as opposed to deepening share of wallet inside the base, cannot be verified. Share velocity is therefore scored as strong but bounded: deepening is proven, market-wide share gain is not.
Taken together, the speed subscore of 15 describes a company that is still running, but no longer accelerating, and whose fastest motion is inside its own base and its own share count rather than in the market at large. That is a coherent mature-company speed profile. It is also a fragile one, because its forward guide points down rather than up, and because the two forces that could restore acceleration — a rebound in expansion revenue and a measured productivity gain from the restructuring — are both, at the as-of date, promises rather than results.
3. Moat: A Platform Lock-In That Is Deep Inside and Narrow Outside
Moat scores 38 out of 60, the largest subscore in absolute points and the axis that carries HubSpot closest to the threshold. Its internal structure, however, is uneven in a way that defines the company. The moat is not one wall but two different kinds of defence, one strong and one modest, and the score keeps them separate. Network effects earn 8 out of 18. The score file is explicit that HubSpot possesses no classical network effect: there is no two-sided liquidity in which each additional user structurally increases value for every other user. What it possesses instead is a compound of three things: Smart CRM as a system of record, the switching cost created by integrating six hubs into a single platform, and an ecosystem of more than 2,000 connected applications together with a Solutions Partner channel. That combination places HubSpot at the top of the anchor band for moats described as a data or ecosystem effect that exists but is weak, a band spanning 5 to 9 points. The comparison in the score file makes the scale of the gap legible: Salesforce's AppExchange, with 6,233 applications and more than 10 million cumulative installations, supports a network-effects score of 16, a full tier above HubSpot's ecosystem. HubSpot's ecosystem is, in the score file's phrase, a tier below in scale. What lifts HubSpot to 8, the same level as Datadog and Zscaler, is the quantitative demonstration of multi-hub lock-in inside the base: 70 percent of installed annual recurring revenue comes from customers using three or more hubs. That figure proves that the switching cost is real for the customers who matter most to revenue, even though it does not prove a network effect across the market. The withheld points above 10 record the missing element plainly: without two-sided liquidity, the moat cannot reach the higher bands no matter how strong the switching cost becomes.
Distribution scalability earns 10 out of 18, the highest moat item, and it is HubSpot's signature. The mechanism is described in the company's annual report, on a confirmed basis, as a product-led growth engine: a freemium entry point leading to in-product, touchless or low-touch cross-selling and upselling across hubs. That structure is rare among mature software companies, most of which depend on a sales force to acquire and expand every account, and it is why distribution, rather than network effects, is identified in the score file as HubSpot's primary growth lever. The partner channel reinforces the product engine rather than replacing it: on a press-reported basis from Analyst Day coverage dated 2026-09-18, upmarket deals involving a partner show a win rate 8 percentage points higher, an average selling price 75 percent higher, and a net revenue retention rate 14 percentage points higher than deals without partner involvement. Those lifts are large, and they explain why the score enters the 10 to 14 anchor band for strong viral or large-distribution-partner models, at its lower end. What holds the score at 10, rather than higher, is the measured efficiency of expansion. Net revenue retention of 103.5 percent for fiscal 2025 on the new calculation method, and approximately 102 percent in the second quarter of 2026 on a press-reported basis, is far below Datadog's retention in the low 120 percent range, which supports a distribution score of 12. The asymmetry is the point of the whole moat assessment: the acquisition engine is blitz-grade, because the product itself acquires customers, while the expansion engine is ordinary, because existing customers expand only modestly. A distribution system that acquires brilliantly and expands modestly will grow by adding logos faster than by growing accounts, and that is exactly the pattern the customer and retention figures show.
Market size earns 9 out of 12, and it is the item where the gate judgment and the moat judgment meet. Gate 2 passes on an estimate, and the market-size score records the same estimate with its limits attached. The bar is set from trailing-twelve-month revenue of $3,449.0 million, calculated as fiscal 2025 revenue of $3,131.3 million minus first-half 2025 revenue of $1,475.0 million plus first-half 2026 revenue of $1,792.7 million, cross-checked against Securities and Exchange Commission EDGAR company-concept data, multiplied by ten to give approximately $34.5 billion. The score file notes that calculating the bar from full-year 2026 guidance instead would give approximately $36.8 billion, and that the verdict would be the same either way. Against that bar, the core customer relationship management market is estimated at approximately $100 billion or more, roughly three times the bar, and third-party estimates for 2035 range from $165 billion to $364 billion. The individual third-party estimates cited are directionally consistent but widely spread, and the score file preserves that spread rather than selecting a single figure: SNS Insider estimates the global customer relationship management market at approximately $103 billion in 2025 rising to approximately $364 billion in 2035, while Market Research Intellect estimates the enterprise segment at $63.8 billion in 2025 rising to $165.0 billion in 2035, both on a press-reported basis. The discounts from a higher mark are structural. The company discloses no quantitative total addressable market in its annual report, so the entire judgment rests on external estimates, which is why the verdict is labelled an estimate throughout. And HubSpot's effective market is not the whole core market but the mid-market segment, defined in the score file as companies with 2 to 2,000 employees, a slice of the broader market, while the enterprise segment is dominated by Salesforce. HubSpot therefore receives the same 9 points as Salesforce for market size, but for a different reason: Salesforce occupies the larger market, while HubSpot's market is large enough in absolute terms even after narrowing to its segment.
Gross margin earns 11 out of 12, the strongest single item in the entire assessment, and it is the clearest evidence that the business model itself is sound even where its growth is slowing. GAAP gross margin moved from 84.4 percent in fiscal 2023 to 85.0 percent in fiscal 2024, then to 83.8 percent in fiscal 2025 and 82.9 percent in the first half of 2026, with subscription gross margin at 85.5 percent in fiscal 2025. Those levels are described in the score file as among the highest of comparable software companies, above Salesforce at 76.6 percent and ServiceNow at a non-GAAP 80.5 percent, both of which also receive 11 points. The economics around the margin reinforce the picture: non-GAAP free cash flow of $594.9 million in fiscal 2025, up 21.9 percent, accompanied by a turn to GAAP operating profitability, from an operating loss of $200.9 million in 2023 to operating profit of $7.4 million in 2025, and a second-quarter 2026 quarterly operating profit of $43.3 million as recorded in the score file. The single point withheld from the maximum records the direction of travel rather than the level: the margin has fallen from 85.0 percent to 82.9 percent, and the score file raises the possibility that artificial intelligence inference costs are entering the cost structure on a structural basis. A superb level with an adverse direction is scored as 11, holding both facts at once, and that discipline — refusing to let either the level or the direction erase the other — runs through the whole assessment.
4. Creative Destruction: The First Substitution Complete, the Second Still a Pilot
Creative destruction scores 9 out of 15, three points on each of its three items, and that uniformity is itself informative. HubSpot is not a company in the middle of one dramatic destruction. It is a company between destructions: the first is largely finished, the second is narrowly begun, and the middle item, behaviour change, sits between a deeply settled old behaviour and a new behaviour that is forming but not yet pervasive.
The order being displaced earns 3 out of 5. The first displacement — fragmented point tools and expensive enterprise software giving way to an integrated mid-market platform — is described as substantially progressed and approaching completion. That is a success, but in scoring terms a completed substitution no longer earns the points of an ongoing one, because the creative destruction item measures displacement in progress rather than displacement already banked. The second displacement is the attempt to change how software itself is charged for, moving from seat-based subscription pricing toward a hybrid of seats plus credits tied to outcomes, described by management with the phrase "outcomes era." The score file treats that management claim with the caution it deserves: the hybrid pricing pilot is limited in scope to the Nordics and Benelux regions, having begun in September 2026, and it is therefore scored as displacement in progress but limited in range, the anchor description for 3 points. The structural paradox recorded for Salesforce applies equally here, and the score file states it directly: the order being displaced, traditional seat-based software, includes HubSpot's own core business. A company displacing its own pricing model is attempting the hardest form of creative destruction, because success requires it to cannibalise the revenue stream that currently funds it, and the score of 3 reflects both the ambition of that attempt and the narrowness of its present footprint.
Irreversible behaviour change also earns 3 out of 5, and the evidence splits in the same way between a settled behaviour and a forming one. The settled behaviour is deep: inbound methodology combined with using customer relationship management as a system of record is entrenched in the mid-market, and the 70 percent of installed annual recurring revenue from customers using three or more hubs is the quantitative trace of that entrenchment. Work organised around a single system of record, across marketing, sales, service, and content, is not lightly abandoned, and the multi-hub pattern shows that entrenchment deepening rather than thinning. What prevents a higher mark is the measured strength of retention. Net revenue retention of 103.5 percent on the new method is weaker lock-in, in the score file's reading, than the kind of entrenchment that would earn the top anchor of 5 points for irreversibility, and weaker than ServiceNow's pattern, where a renewal rate of 98 percent supports 4 points. The forming behaviour is artificial intelligence agents in daily use. Among Pro Plus customers, the agent usage rate reached 19 percent in August, double the level at the start of the year, and monthly agentic actions grew 3.5 times, both on a press-reported basis from Analyst Day coverage. The direction is fast and the absolute level is low, and the score of 3, anchored as behaviour change in progress, holds exactly that combination. A behaviour that has doubled to less than one-fifth of a customer tier is moving quickly and has not yet arrived.
Cost structure change earns 3 out of 5 on two parallel attempts, one aimed at customers and one aimed at HubSpot itself, neither yet measured at the level of unit cost. On the customer side, the seats-plus-credits hybrid pilot is the attempt to monetise agent workloads through credits, converting agent work into revenue that is not tied to headcount. On the company's own side, the approximately 7 percent restructuring is the attempt to secure artificial intelligence leverage in the cost base, together with the 2030 goals of a 30 percent non-GAAP operating margin and stock-based compensation falling to 10 percent of revenue, both on a press-reported basis. The score file places HubSpot at the same level as Salesforce, whose own cost reduction of $100 million in demonstrated savings also earns 3 points, because in both cases direction and declaration exist while a measured collapse in customer unit cost has not been disclosed. The symmetry is instructive: a company can change its own cost structure and its customers' pricing structure at the same time, and still score in the middle, if neither change has yet produced a published unit-cost figure that proves the change has landed. Creative destruction, in this model, is scored on demonstrated change, not on announced intent, and HubSpot's 9 points are the price of that discipline.
5. Deductions and Risks: A Clean Sheet With Five Observations Attached
Demerits total zero, and the smallness of that number should not be mistaken for an absence of risk. It means something narrower and more precise: none of the four classic sources of fragility — debt distress, revenue quality failure, governance capture, or major regulatory cost — currently applies with force, on confirmed evidence, at the as-of date. Each zero, however, carries an observation that the score file attaches to it, and those observations are where the risk analysis actually lives. A reader who stops at zero will miss the substance. A reader who reads the observations will understand why a company with no deductions can still sit below the threshold.
Debt earns 0, with no trigger. Convertible notes stand at zero on a confirmed basis. Lease liabilities are approximately $237 million. Total debt of $1,787.9 million is 0.52 times trailing-twelve-month revenue, against equity of $2,066.2 million, and cash plus investments of approximately $1.38 billion as of 2026-06-30 leave the company close to a net cash position. The observation attached to this clean result concerns stock-based compensation, which totalled $528.2 million, equal to 16.9 percent of revenue. That level is high in absolute terms even though it has fallen along a clear trajectory, from 19.9 percent to 19.2 percent and then to 16.9 percent, and the score file records why it does not attract a deduction: share repurchases more than offset dilution, so that shares outstanding fell by 5.5 percent in six months despite the compensation expense. The restructuring cost of $65 million to $75 million, to be recognised in the fourth quarter of 2026 as a one-time GAAP item and excluded from non-GAAP results, on a confirmed basis, is also recorded here rather than as a debt item, because it is a declared one-time cost of the transition rather than a balance-sheet fragility. The debt picture is therefore genuinely strong, and the watch item is not leverage but whether compensation continues to fall toward the 2030 goal of 10 percent of revenue, and whether repurchases continue to outpace it.
Revenue quality earns 0, with no restatement and no audit issue on a confirmed basis, and with subscription revenue at 98 percent of the total, the quality of the revenue itself is high. The observation attached here is a break in comparability that matters for every retention figure in this assessment. In 2025 the company changed its net revenue retention calculation method to remove the effect of Solutions Partner commissions. The old method gave 103.9 percent in 2023 and 102.2 percent in 2024, while the new method gives 103.0 percent, 101.8 percent, and 103.5 percent across the comparable series, creating a break in the time series. The change itself was disclosed, so it is not a restatement and it does not attract a deduction under the current model, but a reader comparing retention across years without knowing about the change will misread the trend. The score file flags this as a candidate for a future version of the model, in which a disclosed definitional change might be recorded as an observation tag on revenue quality even without a deduction, and that proposal is worth carrying forward. For the present score, the practical consequence is that the retention figures of 103.5 percent and approximately 102 percent must always be read with their method label attached, and long-run retention comparisons must be made within one method or the other, not across the break.
Governance earns 0, with a single-class share structure and no dual-class voting rights on a confirmed basis. Founder ownership is low: chief technology officer and co-founder Dharmesh Shah holds 2.6 percent, co-founder Brian Halligan holds less than 1 percent, and officers and directors together hold 3.7 percent, while the largest institutional holders are dispersed, with T. Rowe Price at 10.2 percent, Vanguard at 10.0 percent, and BlackRock at 6.4 percent, all on the basis of the definitive proxy statement dated 2026-04-27. The observation attached is a personnel change disclosed shortly before the as-of date: chief legal officer Erika Fisher gave notice of resignation on 2026-10-08, effective 2026-11-06, described as pursuing another opportunity, with no disagreement disclosed in the 8-K of 2026-10-09. A single executive departure, disclosed without disagreement, does not disturb a governance score, but it is recorded because the timing — immediately before a restructuring and a pricing transition that will both generate legal and contractual work — makes the legal function one of the roles to watch in the next two quarters, even though no inference about motive is drawn from the filing.
Regulation and social cost earn 0, with no material regulatory action, fine, or breach disclosed on a confirmed basis. The observation attached is not a regulatory cost but a product risk that the annual report itself names: the risk factors in the annual report state that substantial resources may be invested in artificial intelligence products, including Breeze, that the market may not accept. That is a product risk rather than a regulatory cost, so it is reflected in the creative-destruction items rather than as a deduction here, but its placement in the company's own risk disclosure gives it a weight that a press report alone would not carry. It is the company's own statement that the agent transition, on which the second growth curve depends, may fail to find acceptance after significant spending, and that statement is the formal counterpart to the score file's insistence that agent revenue remain unquantified until it is quantified.
Stepping back from the four zeroes, the risk picture resolves into the score file's own framing of the single largest failure point. HubSpot's seat-based pricing is on the menu when agents begin to consume seats. The seats-plus-credits transition is a bet that the company can replace its own core pricing model before an outside agent platform replaces it for them, and the bet is riskier for HubSpot than the equivalent paradox is for Salesforce, because HubSpot is smaller and its retention buffer is thinner. If agent acceptance disappoints, in line with the risk factor the company itself discloses, the company faces the double burden the score file names: decelerating growth and pricing confusion at the same time, with less cushion to absorb either. If the transition succeeds, the same bet becomes the ignition of the creative-destruction items. That symmetry — one bet, two opposite outcomes, both visible in the same figures — is why the score file calls HubSpot a company awaiting verification rather than a company that has succeeded or failed.
6. What to Watch
Several observable markers will determine whether this 62/B rises above the threshold, stays level, or falls, and each of them is already named in the score file's evidence. The first is agent revenue itself. Breeze usage indicators exist in abundance: Data Agent active customers above 16,000 and Prospecting Agent customers at approximately 17,000, both on a press-reported basis from Analyst Day, together with the Pro Plus usage rate of 19 percent and the 3.5-times growth in monthly agentic actions. What does not exist, on a confirmed basis, is a revenue figure for Breeze in either the annual report or quarterly releases. The moment the seats-plus-credits pilot in the Nordics and Benelux converts into disclosed revenue, or the moment a quarterly release first quantifies agent contribution, the second growth curve moves from candidate to evidence, and the creative-destruction items that currently sit at 3 points each become capable of moving. Until that moment, any claim about the size of the agent business is a usage claim, not a revenue claim, and this assessment records it as such.
The second marker is net revenue retention, read always with its method label. Fiscal 2025 retention of 103.5 percent on the new method and second-quarter 2026 retention of approximately 102 percent on a press-reported basis describe an expansion engine that is modest by platform standards. A rebound in that figure, on the same method, would support both the growth item and the distribution item, because expansion revenue is the bridge between acquiring a customer and growing with that customer. A further decline would confirm the opposite reading, that the multi-hub lock-in is deep but not expanding, and would put downward pressure on the growth trajectory that guidance already points toward. Because the 2025 method change breaks the long series, the comparison that matters is within the new method: 103.0 percent, 101.8 percent, and 103.5 percent are the baseline, and the next readings should be judged against that baseline rather than against the old-method figures of 103.9 percent and 102.2 percent.
The third marker is the productivity result of the restructuring. Headcount of 9,016 at 2026-06-30 and revenue per employee of approximately $383,000 on a trailing-twelve-month basis are the pre-restructuring baseline. The restructuring of approximately 7 percent of the workforce, at a one-time GAAP cost of $65 million to $75 million in the fourth quarter of 2026, is a declared attempt to reach a flatter and faster organisation and, by 2030, a 30 percent non-GAAP operating margin, a 20 percent GAAP operating margin, and stock-based compensation at 10 percent of revenue. None of those goals is yet a result. The test will be whether headcount falls and revenue per employee rises in the quarters after the restructuring, without a corresponding break in the growth rate or in the upmarket deal momentum that currently supports share velocity. A productivity gain achieved by shrinking the company faster than it grows would not be the same achievement as a productivity gain achieved while growth holds, and the score file's treatment of the restructuring as a declaration rather than a result is the discipline that keeps those two outcomes distinct.
The fourth marker is the upmarket and multi-hub momentum that currently carries share velocity. Deals above $120,000 in annual recurring revenue growing 38 percent year on year, and 70 percent of installed annual recurring revenue from customers using three or more hubs, are the strongest demand-side figures in the assessment. If those figures hold or strengthen while customer growth slows from 17 percent to 14 percent, the reading is deepening rather than broadening, and the platform grip is doing the work that logo growth used to do. If the larger-deal growth rate fades toward the customer growth rate, the deepening story weakens with it. Average subscription revenue per customer, growing only 3 to 6 percent, is the accompanying figure to watch, because it translates the hub and deal patterns into the revenue realised per account.
The fifth marker is margin direction. GAAP gross margin has moved from 85.0 percent in fiscal 2024 to 83.8 percent in fiscal 2025 and 82.9 percent in the first half of 2026, and the score file raises artificial intelligence inference costs as a possible structural cause. If that decline stabilises, the withheld twelfth point on gross margin becomes reachable, and the margin story becomes one of a superb level defended. If it continues, the question becomes whether operating leverage — visible in the turn from a $200.9 million operating loss in 2023 to a $7.4 million operating profit in 2025 and a $43.3 million quarterly profit in the second quarter of 2026 — can continue to offset a falling gross margin, and for how long. The 2030 margin goals give that question a distant answer; the next two quarters will give it a nearer one.
Two further items sit outside the score but inside a careful reader's judgment. The valuation note, which the model deliberately excludes from the score, records a share price of $214.40 and a market capitalisation of approximately $11.0 billion as of 2026-10-02, both on a press-reported basis, a price-to-sales ratio of approximately 3.2 times trailing-twelve-month revenue of $3.45 billion, and a 52-week range of $169.63 to $503. The score file notes that market capitalisation at that level is only approximately 32 percent of the $34.5 billion Gate 2 bar, describing a shape in which price sits behind the business ceiling, while insisting, following the lesson of BlitzLab's earlier testing, that a business score and a market price measure different things. That figure is recorded here, labelled as press-reported and kept separate from the score, for readers who care about the distance between a business ceiling and a price, without allowing that distance to move the score itself. And the third-quarter 2026 results, expected in November 2026 and excluded from this assessment because they fall after the as-of date, will be the first new evidence on every marker above. The score file notes that third-party calendars conflict on the date, with TipRanks giving 2026-11-11 and MarketBeat giving 2026-11-04, and that company investor-relations confirmation is unconfirmed, so no date is asserted here. When those results arrive, they should be read against the baseline recorded in this assessment — growth guidance pointing to 14 percent, retention at approximately 102 percent, headcount at 9,016, and agent revenue unquantified — rather than against expectations formed after the fact. HubSpot at 62/B is, in the end, a portrait of a graduated blitzer whose first substitution is complete, whose platform grip inside its base is proven, whose expansion engine is ordinary, and whose second curve is assembled but unverified: a company with the materials for re-ignition, waiting on the numbers that would prove it.
More Platforms companies
Other Platforms names on the Blitz Index, highest score first: Alphabet (83/A), Meta (78/B), Airbnb (76/B).
Next earnings
Q4 2026 · Expected
Coverage
HubSpot, Inc. · Q3 2026 due Nov 4, 2026 (expected) · Score 62 · Grade B
Embed this score
Copy the HTML below to show this score on your site. The badge links back to this page and updates automatically when the score changes.
Preview:
BlitzLab scores businesses against a scholar’s standard — not investment advice. No price targets, no buy/sell recommendations. Figures are from SEC filings (XBRL) as labeled in the source scorecard.