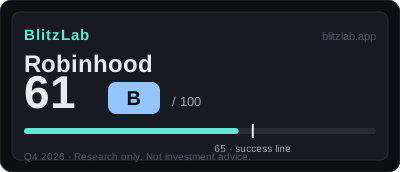
Robinhood — Blitz Index 61 (B)
Customers +7%, assets +67% — the blitz moved from account counts to asset share.
Last re-scored: October 27, 2026.
Confidence: High · S&P 500 · Category: platforms
Score breakdown
| Section | Score | Detail |
|---|---|---|
| A · Speed | 18 / 25 | TPA $322B (+67%); net deposits $68.1B (+35%); ARPU +40% |
| B · Moat | 39 / 60 | Prediction markets $84M→$302M; 14 $100M+ annual lines; $171 ARPU |
| C · Creative destruction | 13 / 15 | Democratized finance as distribution strategy — brokerage to banking superapp; Q3 event contracts $173M, 6x+ YoY |
| D · BlitzFailing | −9 | Founder 58.1% vote; ~$80M in fines over 18 months; prediction-market grey zones |
Think we scored it wrong? Score it yourself →
Radar axes (0–100): Moat 65 · Speed 72 · Creative 87.
Watch item
Gates: G1 ✓ · G2 ✓. 4 points below the threshold — first score. H1 2026 +24% after FY2025's +52%: the dual-cycle engine's first headwind test.
Strengths
- TPA $322.1B (+67%) · net deposits $68.1B (+35%)
- 13 business lines at $100M+ annualized run-rate
- Adjusted EBITDA $2,520M (+76%)
- Institutional discovery: +139 13F holders (2026Q2)
Concerns
- H1 2026 revenue +24% — past the cycle peak?
- 59% trading-based + 34% net interest — a double hit if both cycles turn
- Founder 58.1% voting power + Bhatt departure
- ~$80M in fines over 18 months — the cost of growing in grey zones
Research notes
1. Current Position: A Harvesting Blitzer, Five Points Short of the Line
Robinhood Markets, Inc. enters this scoring period as a company in transition, and the score of 61 out of 100, grade B, captures that transition more precisely than any single growth figure could. This is the company's first scoring in the BlitzLab system, assessed as of October 16, 2026, with the latest results available at that date being the second quarter of 2026, filed on July 30, 2026. Third-quarter 2026 results, normally expected in late October, fall after T and are therefore excluded from this assessment. The classification recorded in the score file is GROWTH, with trailing-twelve-month revenue of approximately $4.93 billion, and the confidence level is recorded as high, resting on direct review of the full texts of the fiscal 2025 Form 10-K, the second-quarter 2026 Form 10-Q, Form 8-K filings, and the definitive proxy statement on SEC EDGAR, with key figures cross-checked against XBRL data. Total net revenue of $4,473 million and net income of $1,883 million for fiscal 2025 were verified in that cross-check and matched.
Both gates of the BlitzLab model pass, but they pass on different kinds of evidence, and that difference matters for everything that follows. Gate 1, which asks whether growth continues or a second growth curve exists, passes on confirmed figures. Total net revenue reached $4,473 million in fiscal 2025, up 52 percent year on year, while funded customers reached 27.0 million, up 7 percent, total platform assets reached $322.1 billion, up 67 percent, net deposits reached $68.1 billion, with a growth rate of 35 percent, and average revenue per user reached $171, up 40 percent. Customers, assets, and unit revenue accelerated together. Fiscal 2024 had been the first annual profit, at $1,411 million, and fiscal 2025 expanded that profit to $1,883 million. Alongside the first curve, second curves are already producing revenue rather than merely being promised: prediction markets, Banking, the Gold Card, and Strategies are all named in the score file as second curves in the stage of being demonstrated in revenue. Gate 1 therefore passes not on a single number but on a combination of a growing first business and second businesses that have begun to show up in the accounts.
Gate 2, which asks whether the ten-year ceiling of the new market is at least ten times current revenue, also passes, but on an estimate rather than a confirmed figure. Ten times trailing-twelve-month revenue of approximately $4.93 billion sets a bar of approximately $49.3 billion. Against that bar, the company-presented total addressable market of more than $600 billion stands at roughly twelve times the bar, with room to spare. That figure is composed, in the company's own presentation, of a global financial ecosystem of more than $400 billion, next-generation wallet share of more than $180 billion, and active traders of more than $20 billion, with penetration of less than 1 percent on a last-twelve-months basis as of the second quarter of 2025, on the company's own claim. The score file is explicit that this total addressable market is the company's own estimate, with no independent verification, and it comes from the company's investor presentation of September 2025. The gate passes with a wide margin on the company's arithmetic, but the provenance of the figure is weaker than the confirmed operating figures behind Gate 1, and the assessment keeps that distinction visible throughout.
The arithmetic of the total is straightforward, and it is worth stating at the outset because it frames the whole judgment. Speed contributes 18 out of 25, moat contributes 39 out of 60, and creative destruction contributes 13 out of 15, for 70 points before deductions. Deductions of 9 points bring the total to 61, grade B, four points short of the 65-point line that BlitzLab treats as success. No flag applies, since deductions of 9 sit below the 15-point flag threshold. Converted to the radar-chart axes used by the model, moat stands at 65.0 on a 100-point scale, speed at 72.0, and creative destruction at 86.7. Creative destruction is therefore the strongest axis in relative terms, speed is next, and moat, though the largest subscore in absolute points, is the weakest relative to its maximum. That pattern already tells much of the story: this is a company that has genuinely changed how people interact with financial services, that is still moving quickly, and whose durable edge, while real, is less firmly established than its disruption.
2. Speed: Growth That Is Decelerating in Revenue and Accelerating in Assets
Speed scores 18 out of 25, and its internal split is the single most informative feature of this assessment. Growth itself earns 8 out of 10, the strongest speed item, on the strength of fiscal 2025 revenue of $4,473 million, up 52 percent year on year, following fiscal 2024 growth of 58 percent, from $1,865 million to $2,951 million, with trailing-twelve-month revenue calculated at approximately $4,932 million. The score file also records thirteen business lines each running at an annualized rate above $100 million, which is direct evidence that growth is broadening beyond a single product rather than depending on one line alone. But the item is marked down one point from 9, and the reason is stated plainly: first-half 2026 revenue of $2,375 million compares with $1,916 million in the first half of 2025, an increase of 24 percent, which is a clear deceleration from the 52 percent pace of fiscal 2025. Within that half, first-quarter growth was 15 percent and second-quarter growth was 32 percent, so the deceleration is not a uniform collapse but a step down in pace. The asset side of the business, by contrast, remains explosive, with total platform assets up 67 percent and net deposits up 35 percent, and the growth item therefore holds two facts at once: revenue growth is slowing, while the asset base on which future revenue depends is still expanding very fast. A score of 8 reflects that combination rather than choosing one half of it and ignoring the other.
Capital velocity earns 4 out of 5. The reasoning turns on a change of phase rather than on any difficulty in raising money. The company had been effectively debt-free in substance, but on June 25, 2026, it issued $2.2 billion of 0.00 percent convertible notes maturing in 2029, together with $123 million of capped calls to hedge dilution. Share repurchases of $653 million in fiscal 2025 and $664 million in the first half of 2026 show capital being returned to shareholders at the same time. Cash stood at $5,362 million in the second quarter of 2026. Access to capital is therefore recorded as first-class, but the item is scored at 4 rather than the maximum because the phase has changed: this is no longer the blitzscaling stage in which external capital is the fuel for expansion, but a stage of financial optimization, in which a zero-coupon instrument, a dilution hedge, and buybacks are used to manage the balance sheet and the shareholder base. The point withheld is a judgment about what the capital is for, not about whether it can be obtained.
Hiring and productivity earn 3 out of 5, on a similarly mixed record. Headcount was approximately 2,900 employees as of December 31, 2025, and in June 2026 the company announced a reduction of approximately 10 percent, described in the score file as a move toward a high-performance culture and lean operations. Revenue per employee, on a trailing-twelve-month basis, is approximately $1.70 million, which the score file describes as first-class productivity. The item is nevertheless scored in the middle of its range because hiring itself is in a contraction phase: a company cutting headcount by a tenth is not, at that moment, expanding its workforce as a blitzscaling company typically does, however productive the remaining workforce may be. The score thus separates two questions that are often confused, namely whether each employee produces a great deal, which here is answered affirmatively, and whether the organization is growing its headcount to fuel expansion, which here is answered negatively.
Share velocity earns 3 out of 5, and here the split between customers and assets reappears in its sharpest form. Funded customers reached 27.0 million in fiscal 2025, an increase of 1.8 million or 7 percent year on year, rising to 28.4 million in the second quarter of 2026, with quarterly net additions at roughly the one-million level. No quantified market share figure has been disclosed, which the score file records as unconfirmed. Asset inflow share, by contrast, is described as explosive, but customer-count share velocity is in single digits, and the item is scored accordingly. The contrast with the moat section is instructive: the same company that scores only 3 for the speed at which it adds customers scores 12 for the scalability of its distribution when that distribution is measured in assets rather than in accounts. Speed, taken as a whole, therefore describes a company whose revenue growth is decelerating, whose capital is abundant but deployed defensively, whose workforce is shrinking even as its productivity stays first-class, and whose customer growth is modest while its asset growth is not. That is a coherent picture of a first blitz maturing, not of a business stalling outright.
3. Moat: Lock-In Without a Classic Network Effect, and Distribution Measured in Assets
Moat scores 39 out of 60, the largest subscore in absolute terms, and its composition explains why the total stops at 60 rather than clearing 65. Network effects earn 8 out of 18. The score file is candid that a true network effect has not been quantitatively demonstrated. What exists instead is a structural judgment: lock-in in the form of asset concentration and subscription attachment, together with vertical integration through in-house clearing and a futures commission merchant capability, and brand. The correlates of that lock-in are confirmed and substantial. Gold subscriptions reached 4.84 million, up 58 percent, margin loans reached $21.6 billion, up 127 percent year on year, and retirement assets under custody reached $34.5 billion, up 82 percent. Each of those figures describes a customer who has tied more of their financial life to the platform, whether through a paid subscription, through borrowed money secured against their holdings, or through retirement savings held on the platform, and each raises the cost, practical if not contractual, of leaving. The score file places the item at the top of the anchor band spanning 5 to 9 points. The withheld points record the gap between lock-in and a classic network effect: in a classic network effect, each additional user makes the service more valuable to every other user, and that amplification has not been measured here. Asset concentration and subscription attachment make customers sticky; they do not, on the evidence presented, make the platform more valuable to one customer because another customer joined. The distinction is preserved rather than blurred, and it is why the moat's largest item by maximum points contributes only 8.
Distribution scalability earns 12 out of 18, the strongest moat item, and it is here that the asset story earns its full weight. Net deposits of $68.1 billion in fiscal 2025, up 35 percent, rising to $75.7 billion on a trailing-twelve-month basis, are described in the score file as an asset-inflow machine, and the phrase is apt. The distribution engine is being extended by acquisition, with Bitstamp, TradePMR, and WonderFi named as the acquisition base, together with a Singapore Monetary Authority of Singapore licence obtained on July 1, 2026, and an acquisition agreement covering securities and crypto in Indonesia. New business lines in prediction markets, Banking, and the Gold Card add further channels through which assets and activity can arrive. The discount from the maximum is the same customer-count fact that limited the share-velocity item: customer growth is in single digits, so distribution that is explosive in assets is only moderate in accounts. A score of 12 therefore holds the two measures together, rewarding the asset machine while refusing to let it stand in for customer acquisition that has not happened at the same pace.
Market size earns 9 out of 12, following directly from Gate 2 but with a deliberate markdown. The gate passes on the company-presented total addressable market of more than $600 billion, but that figure is the company's own estimate, drawn from its September 2025 investor presentation, with no independent verification. Under the conservative principle applied by the model, the item is scored one band below where the raw size alone might place it, at 9 rather than higher. The logic is worth spelling out because it recurs in assessments of companies that present their own markets: a market that the company itself has sized is evidence of ambition and of a plausible ceiling, but it is not independent evidence of the size of the opportunity, and the model does not award full marks for a self-presented figure.
Gross margin, in the model's terms the unit-economics item, earns 10 out of 12, and its evidence is the strongest in the moat section. Average revenue per user reached $171, up 40 percent year on year, adjusted EBITDA reached $2,520 million, up 76 percent, and operating cash flow reached $1,638 million in fiscal 2025, rising to $2,758 million in the first half of 2026, alongside net income of $1,883 million. The speed at which unit economics are improving is rapid: customers are worth substantially more per head than a year earlier, and profitability measures are growing faster than revenue. Two points are withheld, and the reason is structural rather than a doubt about the current numbers. Net interest revenue accounts for 34 percent of revenue and transaction-based revenue for 59 percent, so the margin structure depends on cycles, on interest rates and on market activity, in a way that a more diversified revenue mix would not. A score of 10 therefore describes present unit economics that are excellent and a structure behind them that is exposed to the turn of two cycles. That qualification is not a footnote; it is the bridge to the risk section, and it is why the score file insists that the gross-margin mark is a score of current margins, not a score of cycle resilience.
4. Creative Destruction: An Order Being Displaced, and a Behaviour That Will Not Reverse
Creative destruction scores 13 out of 15, the strongest axis in relative terms, and its items score 4, 5, and 4 out of 5. The order being displaced earns 4, on the basis that commission-free brokerage changed the industry standard, with Schwab and Fidelity following by cutting their own commissions. That is a displacement with a clear, observable mechanism: a pricing model that had been standard across the brokerage industry was abandoned by incumbents after a new entrant made free trading the expectation. The displacement is continuing rather than complete, and it is widening in scope. From brokerage, the company is expanding into options, crypto, prediction markets, asset management, and banking, building toward what the score file calls a single-app financial super-app, and in doing so it is blurring the boundary between the traditional broker, whose model rested on commissions, and the bank, whose model rested on deposits. The withheld point records that the substitution is not yet finished: the old order has been forced to adapt, but it has not been replaced outright, and the super-app that would complete the displacement is still being assembled.
Irreversible behaviour change also earns 4, and its evidence is both a standard that has become permanent and a new category that has exploded. Commission-free trading has become a standard that cannot be reversed, in the score file's judgment, because customers now expect it and incumbents have already conceded it. Alongside that established change sits a genuinely new behaviour: event contracts, the prediction-market product, grew in revenue from $84 million in 2024 to $302 million in 2025, which is the explosive demonstration of a new category of activity rather than a cheaper version of an old one. Gold subscriptions at 4.84 million and retirement assets under custody at $34.5 billion add a further dimension, showing investment, saving, and borrowing settling onto a single platform rather than remaining spread across separate providers. The withheld point, as with the displacement item, is a reserve for completion: the behaviour change is real and, in the case of free trading, irreversible, but the single-platform settlement of a customer's whole financial life is a process still under way, not a finished state.
Cost-structure change earns 4 as well, on the arithmetic of a very small workforce operating a very large asset base. Approximately 2,900 employees operate total platform assets of $322 billion, which is approximately $111 million of platform assets per employee on the score file's calculation, and the June 2026 reduction of approximately 10 percent accelerates the lean-operation direction. Average revenue per user rising 40 percent means that unit revenue is expanding against that cost base. The structural contrast drawn in the score file is with a traditional broker such as Schwab, with approximately 33,000 employees, and the difference is not marginal but categorical: a platform operated by a few thousand people against an asset base in the hundreds of billions has a cost structure that a branch-and-headcount incumbent cannot replicate without rebuilding itself. The withheld point again reflects incompleteness rather than doubt about direction: the cost advantage is demonstrated, but the platform is still adding business lines and geographies, and the final shape of its cost structure is not yet fixed. Across all three items, then, creative destruction at 12 out of 15 describes a company well into its disruption, with each item one step short of completion, and the three withheld points are reserves for a finished displacement rather than reservations about whether disruption is happening.
5. Deductions and Risks: Light Debt, Cyclical Revenue, Concentrated Control, and Regulation as a Running Cost
Demerits total 9 points, and their composition is essential to understanding why a company with 69 points before deductions ends at 60. Debt earns only minus 1, the lightest deduction in the section. The $2.2 billion of 0.00 percent convertible notes maturing in 2029, set against trailing-twelve-month revenue, represent total debt of approximately 0.45 times that revenue, while cash of $5,362 million leaves the company in a net-cash position. The burden, in substance, is slight, and the score reflects that. But the item carries a structural warning that belongs in any honest reading of the debt position: net interest revenue of $1,514 million, or 34 percent of revenue, depends on the interest-rate cycle, and the company itself warns in the fiscal 2025 Form 10-K management discussion that a Federal Reserve rate cut would be negative for it. The debt itself is light; the interest-rate exposure of the revenue that services everything else is not, and the item records both halves of that truth.
Revenue quality earns minus 2, and the small size of the deduction should not obscure the work behind it. There has been no accounting restatement, the auditor is EY, and internal control over financial reporting was effective as of December 31, 2025, with no material weakness. That is a clean audit record, and the deduction does not arise from any suspicion of misstatement. It arises from the composition and volatility of revenue itself. Transaction-based revenue at 59 percent is directly tied to market volatility, so a quiet market reduces the largest revenue line without any operational failure. Crypto revenue illustrates the point in its sharpest form, rising from $135 million in 2023 to $901 million in 2025, a roller-coaster that is structural rather than incidental to a business with a large crypto line. Second-quarter 2026 net income also includes a $129 million gain from the deconsolidation of RVI, worth $0.14 of earnings per share, which is a non-recurring item inside a headline profit figure. None of this is presented as an accounting problem; it is presented as a quality problem in the economic sense, namely that a material share of revenue and an element of a quarter's profit do not recur in the way a reader might assume from the headline numbers. A deduction of 2, rather than a larger figure, reflects that the accounts are clean while the revenue mix is cyclical.
Governance earns minus 3, the joint-largest deduction, and it turns on a concentration of voting power that is unusual even among founder-led companies. The founders together hold 58.1 percent of the voting power, with Tenev at 26.1 percent and Bhatt at 32.0 percent, through Class B shares carrying ten votes per share, of which the founders hold 100 percent, under a Founders' Voting Agreement dated July 26, 2021, all confirmed in the 2026 definitive proxy statement dated April 22, 2026. Bhatt has stepped down from management, having co-founded and become chief executive of Aetherflux, but retains the 32.0 percent voting share, which creates a distinctive governance shape: a former executive who no longer runs the company still controls nearly a third of its votes, and the two founders together control an outright majority. Against that concentration, the score file records genuine mitigations: of a ten-member board, all directors other than Tenev, who serves as chair and chief executive, are independent, there is an independent lead director, and clawback and stock-ownership guidelines are in place. The deduction of 3 therefore reflects a balance rather than a one-sided judgment: the formal governance apparatus is sound, but the voting structure means that apparatus operates under majority founder control, and a single point of failure exists in the concentration itself.
Regulation and social cost also earn minus 3, and the pattern behind it is what gives the item its weight. Over the recent eighteen months, the score file records a sequence of penalties: $45 million from the SEC in January 2025, covering Regulation SHO, suspicious activity reports, electronic blue sheets, recordkeeping, and data security; $26 million from FINRA plus approximately $3.76 million in customer restitution in March 2025; $3.9 million from the California Attorney General in August 2024; and $7.5 million from the Massachusetts Securities Division in January 2024. Together these amount to approximately $80 million in penalties over eighteen months, as summarized in the score file's key drivers. Two older matters have been closed, which matters for a fair reading: the 2021 trading-restriction investigation was closed by the SEC in January 2025 and by FINRA in March 2025, and the SEC's crypto Wells Notice was closed in February 2025 without a recommendation for enforcement action. The deduction is therefore not a penalty for unresolved historical investigations, but a recognition that regulation has become a running cost of this business model, and that the frontier on which the company is now growing is itself a regulatory grey zone. Stock Tokens and staking carry the possibility of securities-law claims, and individual states retain independent enforcement power, so the newest growth lines, prediction markets and tokenized products, are being built in areas where the legal treatment is not yet settled. The score file's formulation is precise: regulation is not merely a cost imposed on the business from outside, but a structural feature of growing in a grey zone, and the deduction of 3 prices that structure rather than merely tallying past fines.
Two supplementary signals recorded in the score file, though not reflected in the score, are worth noting for context. Institutional holders numbered 1,406 in the second quarter of 2026 on 13F filings, an increase of 139, holding 608.2 million shares worth $71.5 billion, which suggests that institutional discovery of the company is under way. FINRA short interest stood at 36.2 million shares as of September 15, 2026, equivalent to 1.52 days to cover, which is a low level. Neither signal moves the score, but together they describe a market in which professional holders are accumulating and short positioning is light, which is consistent with a company in the harvesting phase of a first blitz rather than one under active market attack.
6. The Blitzscaling Fit: A Platform Blitzer in Harvest, Planting a Second Blitz
Stepping back from the item scores, the score file's blitzscaling analysis places Robinhood in a recognizable type: a platform blitzer entering harvest. The main lever is the platform itself, the financial super-app, gathering brokerage, options, crypto, prediction markets, banking, and asset management into a single application, under the stated aim of democratizing finance, which the score file treats not as marketing language but as a distribution strategy. The secondary lever is capital efficiency: with effectively net cash and share repurchases under way, the fuel for growth is increasingly internal cash flow rather than external capital. The weak lever is the network effect, where asset concentration and subscription lock-in exist but user-to-user value amplification remains unmeasured. That combination, a strong platform, efficient capital, and a weak classic network effect, is the strategic shape behind the numbers: speed 18, moat 39, creative destruction 12.
The trade-off the company has made between speed and efficiency is equally clear, and it follows the pattern of the later stage of a blitz. It has chosen efficiency, announcing a reduction of approximately 10 percent in headcount in June 2026 and lowering its cost outlook, with adjusted operating expenses plus stock-based compensation guided to a range of $2.675 billion to $2.775 billion. Revenue per employee of approximately $1.70 million is the product of that choice. But the score file adds a caution that should not be lost: a substantial part of the margin improvement may be the product of favourable interest-rate and volatility conditions rather than of efficiency alone, and it is difficult to separate the skill of cost control from the luck of a favourable cycle. Capital, too, is being used defensively rather than aggressively: zero-coupon convertible notes, capped calls to hedge dilution, and share repurchases describe a balance sheet being managed for shareholder value rather than a war chest being assembled for an aggressive new expansion. That is a coherent posture for a company in harvest, but it is a different posture from the one that built the first blitz.
The stage judgment in the score file is that this is the harvest phase of a first blitz, with the seeds of a second blitz being planted. Revenue of $4.5 billion, net income of $1.9 billion, and operating cash flow of $1.6 billion describe a business that has moved from growing fast to earning deeply. The thirteen business lines each running above $100 million annualized are the seeds of a second act, but their revenue contribution is still limited, and the score file is careful not to treat them as a second blitz already achieved. The threshold arithmetic sharpens the point: at 60, the company sits five points below the 65-point line, with moat at 39 and creative destruction at 12 already at the level of a successful company, while speed at 18 holds it back. The key to crossing the line, on the score file's analysis, is demonstrated revenue contribution from prediction markets and Banking, with third-quarter 2026 results identified as the first observation point for that demonstration. The assessment therefore does not prejudge the second blitz; it names the evidence that would establish it and the date on which that evidence first becomes observable.
The single largest risk named in the score file's blitzscaling analysis follows directly from the revenue structure, and it deserves emphasis because it is the risk that could reverse the harvest most quickly. Both engines of the business are cyclical: net interest revenue, at 34 percent, depends on the interest-rate cycle, and transaction-based revenue, at 59 percent, depends on market volatility. A period in which interest rates fall and markets go quiet at the same time would shrink more than 90 percent of revenue simultaneously, and the company itself has warned in its Form 10-K that a Federal Reserve rate cut would be negative. Blitzscaling doctrine includes a rule about surviving bad markets behind a moat, and the score file's judgment is that this company does not yet have that kind of moat: its lock-in is real, but it has not been shown to protect revenue when both cycles turn against it at once. That is not a prediction that both cycles will turn together; it is an observation about what the revenue structure would do if they did, and it is why a company can score 61, with genuine disruption and genuine profitability, and still sit four points short of the line that marks a successful blitzscaling company.
7. What to Watch
Several observable markers will determine whether this 61/B rises, stays level, or falls, and each of them is already named in the score file's evidence. The first is third-quarter 2026 results, which fall after this assessment's as-of date and are therefore excluded here. They will be the first new evidence on two questions at once: whether revenue growth recovers from the 24 percent pace of the first half of 2026 toward the 52 percent pace of fiscal 2025, or whether the deceleration continues, and whether prediction markets and Banking show the revenue contribution that the score file identifies as the key to crossing 65. A recovery in growth, or a demonstrated second-curve contribution, would move the growth item before it moved anything else, and the assessment should be updated against those figures rather than against expectations formed before them.
The second marker is the asset machine itself: whether total platform assets and net deposits continue to grow at rates far above customer growth, and whether average revenue per user continues to rise. If assets keep compounding while customer numbers grow in single digits, the tension at the heart of this score, between an asset score of 12 and a customer score of 3, will persist, and the question for the next scoring period will be whether asset growth eventually converts into customer growth or whether the business settles into a model of fewer, wealthier customers. If asset growth slows toward the customer growth rate, the distribution item will face its first real test, and the moat score will have to be revisited.
The third marker is the interest-rate and volatility environment, and it should be watched as a pair rather than as two separate risks. A Federal Reserve rate cut, which the company itself has flagged as negative, arriving alongside a quiet market would test the double-cycle exposure directly, shrinking net interest revenue and transaction-based revenue together. The margin structure that currently earns 10 out of 12 would then show whether it is resilient or merely favourable, and the distinction between efficiency and cycle luck that the score file raises would begin to resolve in observable figures. Crypto revenue, which rose from $135 million to $901 million over two years, will be a useful early indicator inside that test, since it moves with volatility more sharply than the rest of the business.
The fourth marker is regulation, and it should be watched on the frontier rather than in the rear-view mirror. The historical penalties are now a matter of record, and the 2021 investigation and the crypto Wells Notice are closed, so the next regulatory evidence will come from the new lines: whether Stock Tokens or staking attract securities-law claims, whether individual states exercise independent enforcement power, and whether prediction markets, whose revenue grew from $84 million to $302 million in a single year, remain in the grey zone in which they have grown or acquire a settled legal treatment that constrains them. A new penalty would not by itself change the assessment, since regulation is already priced as a running cost, but a constraint on a growth line would, because it would strike at the second curve on which crossing 65 depends.
The fifth marker is governance, and it is the slowest-moving of the five but the most structural. Bhatt's retention of 32.0 percent of voting power after stepping down from management, combined with Tenev's 26.1 percent, leaves majority founder control in place under the Founders' Voting Agreement, and any change in that structure, whether through a sale, a transfer, or a renegotiation, would alter the governance deduction more fundamentally than any single board appointment. Short of such a change, the mitigations already in place, an independent board majority apart from the chair and chief executive, an independent lead director, and clawback and stock-ownership guidelines, should be watched for whether they continue to operate as described. None of these markers requires a new theory of the company; each is a figure or an event already named in the score file, and the next scoring period should be judged by whether those figures move, in the directions the score file itself identifies, rather than by whether the narrative around the company becomes more or less enthusiastic.
Head-to-head
Robinhood vs Coinbase — side-by-side scorecard comparison.
More Platforms companies
Other Platforms names on the Blitz Index, highest score first: Alphabet (83/A), Meta (78/B), Airbnb (76/B).
Next earnings
Q4 2026 · Expected
Coverage
Robinhood Markets, Inc. · Q3 2026 reported Oct 27, 2026 (AMC) · Score 61 · Grade B
Embed this score
Copy the HTML below to show this score on your site. The badge links back to this page and updates automatically when the score changes.
Preview:
BlitzLab scores businesses against a scholar’s standard — not investment advice. No price targets, no buy/sell recommendations. Figures are from SEC filings (XBRL) as labeled in the source scorecard.