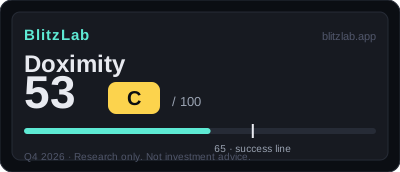
Doximity — Blitz Index 53 (C)
85% of US physicians are inside the network and gross margin is 89% — but growth fell to +7.3% and demerits (−11) take back what the moat earned.
Last re-scored: November 5, 2026.
Confidence: High · Category: platforms
Score breakdown
| Section | Score | Detail |
|---|---|---|
| A · Speed | 14 / 25 | Growth 20.0% → 13.1% → +7.3% (Q1 FY27) with FY27 guided +4–6% — the blitz phase is over; the second curve is usage, not yet revenue |
| B · Moat | 41 / 60 | The densest professional network in the index: 3M+ members, 85%+ of US physicians, 800K+ active prescribers |
| C · Creative destruction | 9 / 15 | Digitized the physician's day (Dialer, Scribe, AI) — about half of active prescribers now use its clinical AI tools |
| D · BlitzFailing | −11 | SBC at 18.9% of revenue, 83% of revenue from 125 customers, securities litigation — 4 points from the FLAG line |
Think we scored it wrong? Score it yourself →
Radar axes (0–100): Moat 68 · Speed 56 · Creative 60.
Watch item
Gates: G1 ✓ (borderline — core decelerating, second curve unquantified) · G2 ✓ (estimate). Bar ≈ $6.5B (FY2026 revenue × 10; ~$6.8B on FY2027E) vs a ~$5.0B market cap — headroom exists; growth is the question.
Strengths
- Network density is measured, not claimed: quarterly active providers 0.58M → 0.81M (+31%)
- Gross margin 89.1% and adjusted EBITDA margin 55.5% — an asset-light cash machine (FCF $317.5M)
- No debt, and $431.7M of buybacks executed into weakness in FY2026
- Clinical AI reached ~50% of active prescribers in Q4 FY26
Concerns
- Deceleration at every level: NRR 119% → 109%, FY27 guidance +4–6%
- Concentration: 125 customers at $500K+ are 83% of revenue — pharma marketing budgets are the exposure
- SBC jumped $72.4M → $121.6M while GAAP operating income fell — dilution is eating the margin story
- Segment and Dialer revenue are never disclosed — the second curve cannot be verified in dollars
Research notes
Thesis: a finished network, a second act still unproven
Doximity is best understood as a company whose first blitz is complete and whose second blitz has only just begun. The first act was the construction of a verified professional network for United States physicians, and by the measures disclosed in the company's filings for the fiscal year ended March 31, 2026, that act is finished: more than 85% of United States physicians are on the platform on the company's own denominator of roughly one million physicians, registered members exceed three million, about two-thirds of nurse practitioners and physician assistants are members, and about 90% of medical students are members. The revenue that this network supports was $644.9 million in fiscal 2026, and the gross margin on that revenue was 89.1%. Those two facts together — a saturated professional graph and a gross margin near 90% — are the substance of the moat score of 41 out of 60, the strongest section of this company's scorecard.
The problem, and the reason the total score is 53 out of 100 rather than higher, is that the growth that built the network has decelerated into a shape that no longer resembles a blitz. Revenue growth was 20.0% in fiscal 2025, 13.1% in fiscal 2026, and 7.3% in the first quarter of fiscal 2027, and the company's guidance for fiscal 2027, after a downward revision, is $671 million to $681 million, or growth of 4.1% to 5.6%. Net revenue retention fell from 119% to 109% over the same arc. The company itself states in the risk factors of its fiscal 2026 annual report that its revenue growth rate may decline in the future, and that decline is now the documented trajectory rather than a hypothetical risk. Doximity therefore scores only 14 out of 25 on speed, and the overall shape of the score — a strong moat, a middling speed, and a creative destruction score of 9 out of 15 — is the arithmetic portrait of a mature platform in harvest, waiting to learn whether a second growth curve exists.
That second curve is the Clinical AI Suite: the Dialer, the Scribe, and the Ask tools that together form an artificial intelligence workflow offering for clinicians. Its usage is real and disclosed in filings. Quarterly unique active providers rose from 0.58 million in the fourth quarter of fiscal 2024 to 0.62 million in the fourth quarter of fiscal 2025 and then to 0.81 million in the fourth quarter of fiscal 2026, an increase of 30.6%, and in the first quarter of fiscal 2027 workflow active prescribers grew 30% year over year. About half of the more than 800,000 active prescribers in the fourth quarter of fiscal 2026 used clinical artificial intelligence, prompts per user roughly doubled from January to April, and AI Search queries rose 25% quarter over quarter in the first quarter of fiscal 2027. What is not disclosed, and what the score file marks as a confirmed non-disclosure, is any revenue figure for the Workflow segment, for the Dialer on its own, or for any of the Marketing, Hiring, and Workflow segments separately. The entire question of Doximity's next chapter therefore reduces to a single gap: usage is accelerating while revenue is decelerating, and no filing yet shows whether the first will become the second.
The gate verdicts reflect that tension honestly. Both gates pass, and both pass only at the borderline. The first gate, which asks whether growth continues or a second growth curve exists, passes because growth, though weak, is still positive — guidance remains above zero, net revenue retention remains above 100%, and the subscription business still grew 11.9% in fiscal 2026 — and because the second curve exists in the form of quantitatively disclosed usage. The second gate, which asks whether the ten-year ceiling of the new market is at least ten times current revenue, passes as an estimate: ten times fiscal 2026 revenue of $644.9 million is approximately $6.5 billion, or approximately $6.8 billion against the midpoint of fiscal 2027 guidance, and the company discloses no quantitative total addressable market figure in its annual report, so the pass rests on the absence of evidence that the ceiling is closed rather than on a disclosed market size. A reader who wants to understand Doximity should hold both halves of that sentence at once: nothing in the filings closes the ceiling, and nothing in the filings shows the company travelling toward it yet.
Moat: a two-sided market whose scale is itself the product
The moat score of 41 out of 60 is built from four items, and each of them is grounded in a filing rather than in a claim about the future. Network effects score 12 out of 18, distribution scalability 11 out of 18, market size 8 out of 12, and gross margin 10 out of 12. Together they describe a business whose defensibility comes less from any single feature than from the accumulation of verified professional identity over more than a decade since the company's founding in 2010 and its listing in 2021.
The network itself is two-sided in a specific and asymmetric way. On one side, physicians join for free. On the other side, pharmaceutical companies and health systems pay. The value to the paying side is reach: when more than 85% of physicians and about 90% of medical students are present, a pharmaceutical brand or a health system is buying access to the profession rather than to a sample of it. The company argues in its annual report that the verified physician database it has accumulated since launch — profiles, affiliations, and specialties — would be very difficult to replicate, and the score file accepts that argument as far as it goes while noting its limit. What is not well evidenced is the kind of network effect in which each physician becomes more valuable to every other physician as more physicians join. The documented connection runs from member scale to paying-customer revenue: existing Marketing customers spent on average 10% more per customer in fiscal 2026, and net revenue retention of 109% shows the existing customer cohort expanding in aggregate. That is a genuine linkage between participation and revenue, and it is why the network score sits in the middle of its anchor band rather than at the bottom. It falls short of the top band, reserved for platform lock-in, because pharmaceutical companies can still reach physicians through in-person sales and other channels; they multi-home, and the platform does not lock them in the way a locked-in operating system or marketplace might.
Distribution is where Doximity's history is most distinctive, and it scores 11 out of 18. The member side of distribution is close to free. A physician can join at no cost, claim a pre-filled profile, and enter through tools such as the Residency Navigator, which captures medical students — about 90% of whom are members — at the very start of their careers and keeps them inside the platform as they grow through their careers. That is, in the score file's phrase, an effectively near-zero customer acquisition cost pipeline for members, and it is a pipeline a competitor cannot buy with money alone because it is built on time: the years over which students became residents, residents became physicians, and physicians built their verified profiles inside one network. The paying side of distribution is different, and the difference is the reason the score is 11 rather than higher. Revenue is won through sales, brand by brand for pharmaceutical customers and service line by service line for health systems, in a land-and-expand pattern of modular subscriptions, and sales and marketing expense was 25.4% of revenue in fiscal 2026. Member acquisition is almost free and revenue acquisition costs a quarter of revenue; that asymmetry is the honest shape of the distribution score. The second axis of distribution has only just opened: partnerships with Aledade and Photon are distributing the Clinical AI Suite to thousands of independent practices, giving the artificial intelligence offering a channel beyond the company's own direct sales.
Market size scores 8 out of 12, and the score is explicitly an estimate. The addressable market, as the score file frames it, is the sum of United States pharmaceutical marketing spending plus health system hiring and workflow software spending, and in absolute terms there is room for that sum to exceed the gate bar of $6.5 billion to $6.8 billion. But the effective market is narrower than the absolute market, because about 83% of revenue comes from 125 customers spending $500,000 or more each, and because the new categories that would have to carry growth — artificial intelligence workflow monetization and any patient-side expansion — have no disclosed revenue yet. The score therefore sits in the same band as companies whose quantitative market headroom is thin or undisclosed, and the file states the condition for a higher score plainly: a disclosed quantitative total addressable market plus revenue evidence from the new categories.
Gross margin scores 11 out of 12, and this is the least ambiguous part of the moat. Gross margin was 89.3% in fiscal 2024, 90.2% in fiscal 2025, and 89.1% in fiscal 2026, on gross profit of $574.5 million in fiscal 2026. Adjusted EBITDA margin was 55.5% in fiscal 2026, and free cash flow was $317.5 million on a press-release basis. The business is asset-light, with effectively no capital expenditure, and that structure is the background of the margin. The single point withheld from a perfect score is direction: the GAAP operating margin fell from 39.9% to 33.3%, GAAP operating income fell in absolute terms from $227.8 million to $214.9 million, and guidance for fiscal 2027 adjusted EBITDA margin is 46% to 48%, down from 55.5%. The level of the margin is close to the best in the scored universe; the trajectory of the margin is downward, and the score reflects both facts at once.
Speed: deceleration that is documented, not rumoured
The speed score of 14 out of 25 is the section that most constrains the total, and each of its four items tells a different part of the same deceleration story. Growth scores 4 out of 10, capital velocity 3 out of 5, hiring and productivity 3 out of 5, and share velocity 4 out of 5.
Growth, at 4, is anchored to the trajectory itself. Revenue was $419.1 million in fiscal 2023, growing 22.0%; $475.4 million in fiscal 2024, growing 13.5%; $570.4 million in fiscal 2025, growing 20.0%; $644.9 million in fiscal 2026, growing 13.1%; and $156.6 million in the first quarter of fiscal 2027, growing 7.3%. The score file places this one point below a comparable mature software company growing 11.8%, because Doximity's leading indicators — net revenue retention and guidance — are worse than its trailing revenue, running in the opposite direction, and because single-digit high growth at a revenue base of about $0.65 billion is not blitz speed. It places the score clearly above a company growing at about 1%, because Doximity is still growing. The judgement is comparative and transparent: the number is not a grade on growth in the abstract but a placement on a scale where the company's own deceleration is the evidence.
Capital velocity, at 3, captures a company whose access to capital and generation of capital are first-rate but whose use of capital is now return rather than expansion. The company has no borrowings, holds $219.2 million in cash, and generated $317.5 million of free cash flow in fiscal 2026. Against that, it executed $431.7 million of share repurchases, completing a $500 million program and retiring 11,591,950 shares, and on February 3, 2026, a new $500 million program was authorized with $492.5 million remaining. Weighted average shares outstanding fell from 213.4 million in fiscal 2023 to 199.0 million in fiscal 2026, a net reduction in dilution. The only expansionary capital deployment of note in the file is the Pathway acquisition for $36.3 million. The score of 3 is the same band given to other companies in a return phase: capital is not the constraint, and capital is no longer the fuel. The buyback program is the mechanism by which dilution from stock-based compensation is offset, and that offset itself consumes cash, a point that returns in the discussion of deductions.
Hiring and productivity, at 3, reflect a workforce growing slowly and a platform producing a great deal of revenue per person. Headcount rose from 830 employees at March 31, 2025, to 880 full-time equivalents at March 31, 2026, an increase of 6.0%, with more than a third of employees in research and development. Revenue per employee is approximately $733,000 for fiscal 2026 on the score file's calculation, which is labelled an estimate. That is the productivity of a high-margin platform, and the score acknowledges it. What keeps the score in the middle is that the hiring trajectory is a gentle increase rather than a blitz surge, and that May 2026 brought new appointments to the chief financial officer and president roles, a management transition phase. Productivity is recognized; speed is not, and the score splits the difference.
Share velocity, at 4, is the strongest of the speed items, and it is strong precisely because the market being won is nearly saturated. Physician penetration rose from more than 80% in fiscal 2025 to more than 85% in fiscal 2026 on the company's denominator, and moving five percentage points inside the 80% range is evidence of share expansion in a saturated band. Registered members rose from more than two million to more than three million, quarterly unique active providers rose 30.6% to 0.81 million, and customers spending $500,000 or more rose from 118 to 125. The discount on this item is a matter of verification: the penetration denominator is the company's own definition, the three-million-plus member count aggregates physicians with other clinician groups, and there is no third-party verification of the penetration rate itself. The share gains are real on the company's disclosed measures; they are not independently verified, and the score says so.
Creative destruction: a clear order being replaced, an irreversible change still in progress
The creative destruction score of 9 out of 15 divides into 4 out of 5 for the order being replaced, 3 out of 5 for irreversible behaviour change, and 2 out of 5 for cost structure change. The pattern is consistent: the target of disruption is clear and large, the behaviour change is under way but not yet proven irreversible, and the cost structure evidence is the weakest of the three.
The order being replaced scores 4 because the target is specific and the replacement already has revenue scale. The first order is pharmaceutical sales conducted through in-person representative visits and offline conferences as the way to reach physicians; Doximity's verified physician network and digital targeting define the replacement category, and $644.9 million of revenue is the demonstrated scale of that replacement. The second order is analogue clinical workflow — telephone, fax, and handwritten records — replaced by the Dialer, the Scribe, and the Ask tools of the Clinical AI Suite. The point withheld from a perfect score is penetration: the replacement is still only part of total pharmaceutical marketing spending, and the workflow replacement is still in progress. The score file applies the same yardstick used for another company whose demonstrated replacement revenue had not yet passed half of its target market, and the result is the same 4.
Irreversible behaviour change scores 3, the anchor band for change in progress. The evidence is the usage acceleration already described: active providers up 31%, about half of active prescribers using clinical artificial intelligence, prompts per user roughly doubling from January to April, and a pipeline that captures about 90% of medical students at the start of their careers and grows with them inside the platform. That is a structure in which behaviour is formed early and carried forward, and it is a meaningful form of stickiness. What keeps the score at 3 rather than 4 is the absence of the quantitative evidence that would show the change cannot be undone: retention or remaining performance obligation figures by tool are not disclosed, and the paying side's measured behaviour change, net revenue retention, is moving in the opposite direction, from 119% to 109%. Until the tools show retention that survives a budget cycle, "difficult to reverse" is a claim the filings do not yet support.
Cost structure change scores 2, the weakest creative destruction item, and the reasoning is careful about what is and is not evidenced. The traces of a structural cost advantage are present: digital reach replaces the marginal cost of an in-person sales force, the asset-light structure with effectively no capital expenditure underlies the 89% gross margin and a free cash flow margin near 49%. But a measured collapse in unit cost is not disclosed — the score file marks it unconfirmed — and the current cost curve runs in the opposite direction, with generative artificial intelligence inference costs entering cost of revenue explicitly and stock-based compensation surging and pressing on GAAP margins. The accurate description of this moment is not that Doximity has destroyed a cost structure but that a business whose cost structure was light is now absorbing new artificial intelligence costs. The score of 2 records that distinction.
Deductions and risks: eleven points, all of them directional
Total deductions are 11 points, four short of the 15-point threshold that would trigger a FLAG, and the composition of those 11 points matters more than the total. Debt scores minus 3 out of a possible minus 10, revenue quality minus 3, governance minus 4 out of a possible minus 5, and regulatory and social cost minus 1. No item is an event that has already happened and been resolved; every item is a trajectory or a structure, which means none of them is cleared by a single quarter of results.
Debt, at minus 3, is not about borrowing, because there is none. Total liabilities of $172.9 million are dominated by $106.5 million of deferred revenue, which is operating liability rather than debt, and the company is in a net cash position with $219.2 million of cash. The deduction is about stock-based compensation, and its trajectory is steep: $51.1 million in fiscal 2024, $72.4 million in fiscal 2025, and $121.6 million in fiscal 2026, rising from 10.7% of revenue to 12.7% and then to 18.9%, and reaching $36.8 million in the first quarter of fiscal 2027, or 23.5% of that quarter's revenue. That surge is the main cause of the 12.2% decline in GAAP net income. The score file compares this with precedents: one company with stock-based compensation at 18.6% of revenue but improving scored minus 2, another at 19.5% and falling scored minus 2, and another at 24.5% scored minus 3. Doximity's absolute level is below the highest of those, but its direction is adverse across every interval and its latest quarter has entered the highest band, so the file applies the trajectory logic of a company with a rising trend and no offset, while stopping at minus 3 rather than going further because the $431.7 million of repurchases did produce a net reduction in weighted average shares. That offset is itself a use of cash, and the file records that too.
Revenue quality, at minus 3, combines concentration with a lawsuit that is at the allegation stage. The concentration is that 125 customers spending $500,000 or more account for about 83% of revenue. That is not the risk of a single customer — the file distinguishes it from a case where one customer was 45% of revenue — but it is dependence on a single spending pool, pharmaceutical marketing budgets, as a cohort, and because segment revenue is not disclosed, the depth of that dependence cannot be verified quantitatively. The lawsuit, reported in press coverage in October 2026 and therefore labelled press-reported rather than filing-confirmed, was filed in 2026 with a purchase period of August 8, 2024, to May 13, 2026, and a lead plaintiff application deadline of November 16, 2026. Its allegations concern statements about market share amid programmatic and social competition. It is at the filing and allegation stage, not a judgement or settlement, and the score file places it in the same band used for other unconfirmed lawsuits, adding the concentration risk to reach minus 3. The decline in net revenue retention is not double-counted here; it is already reflected in the growth score. There is no revenue restatement and no audit issue, and the file records that as an offsetting factor.
Governance, at minus 4, is the largest single deduction, and it is structural rather than episodic. The company has a dual-class share structure in which Class B shares carry 10 votes per share against 1 vote per Class A share, and officers, directors, and related persons hold approximately 79% of the voting power as of March 31, 2026. The score file applies a quantitative anchor line drawn from other scored companies: a voting share in the 30% range scored minus 2, in the 50% range minus 3, and in the 70% range minus 4, with two other companies at about 76% and 74.1% each scoring minus 4. At 79%, Doximity sits at the top of that 70% band, and the file assigns minus 4 while stopping short of minus 5, the band for effectively complete control. The practical meaning is plain: minority shareholders have, structurally, little means to correct the company's course if the deceleration continues. The company is led by co-founder and chief executive officer Jeff Tangney, and the governance deduction is a statement about the structure around that leadership, not about any individual decision.
Regulatory and social cost, at minus 1, is limited to structural exposure. There is no disclosed material fine and no disclosed data breach, and the file confirms that absence. The single point reflects the fact that health privacy regulation, medical data regulation, and personal information regulation sit at the centre of the business itself, and that the clinical artificial intelligence tools widen the company's contact with medical regulation. The securities class action is not double-counted here because it is already reflected in the revenue quality deduction. The score follows the precedent for companies where the issue is exposure rather than an event, and the result is the smallest deduction on the card.
The valuation note in the score file, which does not affect the score, deserves a sentence because it frames the context in which the other numbers sit. Market capitalisation is estimated at approximately $5.0 billion as of August 2026 on a press-reported and estimated basis, implying a price-to-sales ratio of about 7.8 times fiscal 2026 revenue; the Class A closing price was $73.15 on September 30, 2025, against a public float of approximately $9.86 billion shown on the annual report cover, and the share price around the first quarter fiscal 2027 results moved in a range of $20.66 to $27.40 on press aggregation. The business score does not look at price, and this draft follows that rule, but the decline is the background to the repurchase program and to the rising opportunity cost of offsetting dilution, exactly as the score file records it.
What to watch: the gap, and the triggers around it
The single variable that will decide the next scoring is whether the gap between usage and revenue closes. Active providers grew 31% while the most recent quarter's revenue grew 7.3%, and that divergence is the rarest shape in this scoring batch: a company whose users are accelerating into its new product while its revenue decelerates away from it. If the Clinical AI Suite's monetization is disclosed in a future filing — in segment revenue, in Dialer revenue, or in an annual recurring revenue figure for the workflow offering — the second growth curve will have the revenue evidence it currently lacks, and the gate verdicts and the growth and market size scores will have new facts to work with. If the gap persists for two or three more quarters, the interpretation will converge on a harder one: that the artificial intelligence workflow is a tool physicians like rather than a product that pharmaceutical companies and health systems pay more for, and that the company is left with a single-digit-growth core business tied to 125 customers' budgets plus the rising cost of defending that business with inference expense and stock-based compensation.
Three triggers are already written into the score file and should be watched as stated rather than reinterpreted. First, if fiscal 2027 revenue growth turns negative or net revenue retention falls below 100%, the first premise of the borderline first-gate pass — that growth continues, weakly but really — disappears, and the gate would have to be re-examined on usage evidence alone. Second, if the stock-based compensation trajectory worsens by one more band, total deductions will reach the 15-point FLAG threshold, since the current total is 11 and the direction of the largest moving deduction is adverse. Third, the fiscal 2027 second quarter results, due November 5, 2026, fall after this score's as-of date of October 20, 2026, and are therefore a future marker only; no outcome is anticipated here, and the next scoring will read them as new evidence rather than as confirmation of any expectation stated in this draft.
Two quieter items deserve the same discipline. The margin guidance for fiscal 2027, at 46% to 48% adjusted EBITDA margin against 55.5% in fiscal 2026, already tells the reader that the company expects its margin trajectory to continue downward as generative artificial intelligence costs and investment rise; the question is not whether margins compress but whether the compression buys a monetized second curve. And the governance structure, at approximately 79% of voting power, means that whatever the answers to those questions turn out to be, the correction mechanism available to outside shareholders is structurally limited. Doximity at 53 out of 100, grade C, is therefore best read as a precise statement rather than a vague one: a completed network worth 41 points of moat, a decelerating engine worth 14 points of speed, a disruption half-finished at 9 points, and 11 points of deductions that are all about direction. The company has twelve points to make up to reach the 65-point threshold, and the filings are clear about where those points would have to come from: not from the network, which is already built, but from the conversion of usage into revenue.
More Platforms companies
Other Platforms names on the Blitz Index, highest score first: Alphabet (83/A), Meta (78/B), Airbnb (76/B).
Next earnings
Q4 2026 · Expected
Coverage
Doximity, Inc. · Q2 FY2027 due Nov 5, 2026 (AMC, confirmed) · Score 53 · Grade C
Embed this score
Copy the HTML below to show this score on your site. The badge links back to this page and updates automatically when the score changes.
Preview:
BlitzLab scores businesses against a scholar’s standard — not investment advice. No price targets, no buy/sell recommendations. Figures are from SEC filings (XBRL) as labeled in the source scorecard.