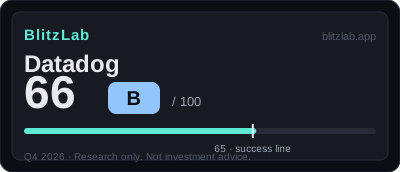
Datadog — Blitz Index 66 (B)
Thirteen straight quarters of 24%+ — one point above the success line.
Last re-scored: November 4, 2026.
Confidence: High · S&P 500 · Category: platforms
Score breakdown
| Section | Score | Detail |
|---|---|---|
| A · Speed | 19 / 25 | 13 straight quarters ≥ +24%; Q3 +35.2%, re-acceleration in a third quarter |
| B · Moat | 40 / 60 | NRR low-120s%; 86% multi-product (6+ 41%); S&M 26.9% of revenue |
| C · Creative destruction | 9 / 15 | AI observability suite GA — second-curve candidate |
| D · BlitzFailing | −2 | Dual-class (founder 32.8% vote); Nevada move completed Apr 21, 2026 |
Think we scored it wrong? Score it yourself →
Radar axes (0–100): Moat 67 · Speed 76 · Creative 60.
Watch item
One point above the 65-point success line — Q3 2026 rescore (A1 8→9, B1 8→9, B3 10→9). Gates: G1 ✓ · G2 ✓ estimated. Net cash ~$4.25B. Member of the 65+ Club.
Strengths
- Q3 2026 revenue $1.20B (+35% YoY)
- Q4 guide $1.19–1.20B; FY2026 $4.515–4.525B (+32%)
- GAAP operating margin +6.2% in Q3 (from −0.7%)
Concerns
- AI product revenue contribution undisclosed (Scout 1.0 in preview)
- One point above the threshold
- Largest-customer usage fell in Q3 (10-Q)
- OpenTelemetry commoditization pressure
Research notes
1. Current Position: A Mature SaaS Company That Refused to Slow Down
Datadog, Inc. enters this scoring period in a position that the BlitzLab model treats as genuinely unusual. It is classified in the score file as a mature software-as-a-service company, with trailing-twelve-month revenue of approximately $4.28 billion and a market capitalisation of approximately $100 billion on a press-reported basis as of 2026-10-14. Companies at that scale are, in the model's experience, supposed to be decelerating. The familiar arc runs from explosive early growth through a long, gentle descent into single-digit or low-double-digit expansion, and the scoring framework has already recorded that arc in peers: the score file notes that three mature software companies sit at or below the threshold, with ServiceNow at 67, Adobe at 61, and Salesforce at 65. Datadog breaks the pattern, or at least interrupts it, and that interruption is the whole story of this assessment. Thirteen consecutive quarters of year-on-year revenue growth above 24 percent, with re-acceleration now in a third straight quarter, carries the company to 66 points, one point above the threshold, and keeps it in the 65-and-above club alongside Salesforce, Palantir, and MongoDB on the score file's own accounting. There is little margin for error in that position, and the score file says so plainly: a single item moving down would take the company back to the line. But the position is earned rather than gifted, and the evidence behind it is unusually clean, resting on figures confirmed directly from SEC filings rather than on management narrative.
The arithmetic is straightforward and worth stating in full, because the threshold result turns on it. Speed contributes 19 of a possible 25 points, moat contributes 40 of a possible 60, and creative destruction contributes 9 of a possible 15. Demerits subtract 2 points. The total is therefore 19 plus 40 plus 9 minus 2, which equals 66, and the grade is B, the band covering 60 to 79 points. Converted to the three axes the site uses for its radar charts, moat stands at 66.7 out of 100, speed at 76.0, and creative destruction at 60.0. The shape that emerges is a company whose speed is its strongest axis in relative terms, whose moat is broad but not impregnable, and whose creative destruction is real but incomplete. No FLAG applies, because the demerit total of 2 sits far below the 15-point threshold that would trigger one. This is a first scoring for Datadog in the BlitzLab system, conducted without a blind process, on a December year-end, with the latest reported results being the third quarter of 2026, announced on 2026-11-04, including revenue of $1,197.1 million, up 35.2 percent year on year.
Both gates of the model pass, but they pass in different ways, and the difference matters. Gate 1, which asks whether growth continues or a second growth curve exists, passes on confirmed figures. Thirteen consecutive quarters above 24 percent year-on-year growth, confirmed from SEC XBRL data, together with a trailing-twelve-month net revenue retention rate in the low 120 percent range, multi-product adoption of 86 percent for customers using two or more products, remaining performance obligations of $3,847.7 million, and 4,860 customers at $100,000 or more in annual recurring revenue, up 20 percent year on year, collectively demonstrate a business still expanding rather than coasting. Gate 2, which asks whether the ten-year ceiling of the new market is at least ten times current revenue, passes on an estimate. Ten times trailing-twelve-month revenue of approximately $4,278.2 million sets a bar of approximately $42.8 billion. Observability alone, at $39 billion in 2029 on Gartner figures cited in the company's annual report, now sits below that bar. The broader set of markets the company claims to participate in, covering IT operations management, security, application development, and analytics platforms, totals $187 billion in 2029 on the company's own claim as cited in the annual report, or roughly 4.4 times the bar. The gate therefore passes only when adjacent markets are included, and this draft preserves that qualification rather than smoothing it away: on observability alone, the ceiling no longer reaches the bar, and the comfortable margin comes from adjacencies.
The score file's directional note calls Datadog "rising," meaning re-accelerating, and the phrase captures the central tension of the assessment. A mature company that re-accelerates is rarer, and harder to score, than a young company that has never slowed down, because the scorer must decide whether the new slope is a second curve or a final swell before the descent resumes. Datadog's second-curve candidate is named in the score file: artificial intelligence observability, running from LLM Observability in 2024 through Bits AI SRE in 2025 to Bits Code, Bits Chat, and Agent Builder reaching general availability in 2026, and Scout 1.0, a specialized model in preview, in the third quarter of 2026. That sequence is confirmed as a product record. What is not confirmed, and the score file marks it unconfirmed, is how much revenue those products contribute. The second curve is therefore a qualitative candidate rather than a demonstrated one. The company has earned its place on the threshold by refusing to slow down; whether it stays there will depend on whether the artificial intelligence product line turns out to be a genuine second curve with revenue attached, or simply a well-built extension of the first.
2. Moat: An Ecosystem Lock-In Without a Classic Network Effect
Moat contributes 40 of 60 points, the largest block of the score in absolute terms, and its internal structure is more instructive than its total. The first thing to understand is what Datadog's moat is not. Network effects score 9 of 18, and the score file is explicit that there is no direct network effect between users as a matter of structural judgment: one customer's use of Datadog does not directly make the product more valuable to another customer in the way that an additional participant improves a marketplace or a communications network. What exists instead is a platform-ecosystem form of lock-in, and the score file places it carefully between two anchor bands, choosing the top of the lower band on a conservative principle. The evidence for that lock-in is strong and confirmed. Eighty-six percent of customers use two or more products, up from 84 percent a year earlier, while 61 percent use four or more, 41 percent use six or more, 26 percent use eight or more, and 16 percent use ten or more, all confirmed from the third-quarter 2026 quarterly report. Net revenue retention in the low 120 percent range, also confirmed, shows that existing customers do not merely stay but expand their spending. The drawdown contract structure, under which rising usage converts directly into revenue, binds that expansion to the customer's own growth. The moat is therefore best described as depth of integration rather than breadth of network: the more products a customer runs through a single observability platform, the more expensive and disruptive it becomes to peel them away one by one, even though no single additional user improves the product for anyone else. The withheld points record the limit of that mechanism. Depth defends well against a like-for-like replacement, but it does not compound the way a true network does, and the score refuses to pretend otherwise.
Distribution scalability is the strongest moat item at 12 of 18, and it is the item that most directly explains the growth record. The model here is land-and-expand, and the annual report's own language, confirmed from the Business section, describes products as "easy to adopt and have a very short time to value." That short time to value is not a slogan in this assessment; it is the mechanism by which a customer can start small, see results quickly, and then expand usage without a new procurement cycle. The distribution evidence runs in the same direction as the retention evidence. Net revenue retention in the low 120 percent range, against approximately 120 percent a year earlier, shows expansion holding steady rather than fading. Sales and marketing expense as a share of revenue fell gently, from 29.6 percent in fiscal 2022 to 27.9 percent in fiscal 2025 and 26.9 percent for the first nine months of 2026, confirmed from XBRL data. A company whose growth is re-accelerating while its sales and marketing share is falling is, in effect, getting more distribution per dollar of selling effort, which is the signature of a land-and-expand engine working properly rather than a sales force pushing harder. Direct selling combined with self-serve adoption, both confirmed, gives the model two routes to the customer, and the score places this in the anchor band for strong viral or large distribution-partner dynamics, at the lower end of that band. The reservation is one of kind rather than degree: the expansion is developer-led and product-led, powerful within the installed base, but it is not the kind of viral spread that acquires strangers at near-zero cost, and the score holds that distinction.
Market size scores 9 of 12, and gross margin scores 10 of 12, and together they complete a moat that is wide at the top and disciplined underneath. The market-size mark follows directly from Gate 2: observability at $39 billion in 2029 now sits below the $42.8 billion bar, while the claimed participating total of $187 billion in 2029 clears it by a wide margin, and the gate passes. The two withheld points record a specific unconfirmed item: the maximum would require demonstrated share of the observability market alone, and that demonstration is not in the score file. A single-media estimate of 51.82 percent market share is explicitly not reflected in the score, a decision this draft endorses by omitting the figure from any claim about market position: a single press estimate, however flattering, is not a filing, and the model correctly refuses to build a moat point on it. Gross margin, by contrast, rests on confirmed data of the strongest kind. The gross margin band of approximately 79 to 82 percent held for twelve consecutive quarters on XBRL figures, a level of stability at an elite level that few software companies sustain. The two withheld points here record the other side of the profit picture: GAAP operating margin oscillates around breakeven, at negative 1.3 percent for fiscal 2025 and positive 0.5 percent for the second quarter of 2026, turning positive at 6.2 percent for the third quarter of 2026, while the free cash flow margin of approximately 29 percent for fiscal 2025 is an estimate rather than a confirmed filing figure. The gross profit engine is superb; the operating profit conversion is thin. The score holds both facts at once, awarding near-maximum points for the margin structure while refusing the final points until operating profitability thickens.
3. Speed: Re-Acceleration Measured in Quarters, Not Promises
Speed contributes 19 of 25 points, and its composition repays close reading because it is where the re-acceleration story is either proved or merely asserted. Growth itself scores 9 of 10, the highest speed item, and the evidence is a thirteen-quarter run confirmed from XBRL data rather than a single strong quarter. From the third quarter of 2023 through the third quarter of 2026, year-on-year growth never fell below 24 percent. Within that run there are distinct phases: a stable period of approximately 25 to 27 percent growth through 2023 and 2024, a move from 25 percent toward 28 percent during 2025, and then a genuine re-acceleration in the first half of 2026, with growth of 32.2 percent and 35.6 percent in the two quarters, continuing into the third quarter at 35.2 percent. No transition into a slower, 20-percent range occurred, which is the event the score file was watching for and did not find. Guidance for fiscal 2026 of $4.515 to $4.525 billion, implying 31.8 to 32.1 percent year-on-year growth and confirmed from the earnings release of 2026-11-04, points in the same direction as the reported quarters. The two withheld points record the model's discipline about what counts as explosive: growth in the low-to-mid 30 percent range at a revenue base approaching $4 billion is outstanding for a mature company, but it is not the 100-percent-plus explosion that the top mark reserves for a company doubling, and the score does not inflate a mature re-acceleration into a young company's breakout.
Capital velocity scores 3 of 5, and the reasoning here is a useful lesson in how the model treats absence of evidence. Datadog's access to capital is of the highest order on the score file's reading: a market capitalisation of approximately $100 billion on a press-reported basis as of 2026-10-14, net cash of approximately $4.25 billion calculated from confirmed filing figures, and convertible notes of $986.6 million carrying a zero percent coupon and maturing in 2029. What is missing is activity. No share repurchase programme is disclosed in the filings, and there is no recent history of equity issuance to measure. Capital velocity, as the model defines it, is measured by the speed and scale at which a company actually raises and deploys capital, and a company that has not needed to raise any offers no signal to measure. The score of 3 therefore records neither strength nor weakness in any absolute sense; it records the absence of a measurable event, and this draft preserves that framing rather than converting a fortress balance sheet into a capital-speed claim it cannot support. A company that can fund itself from its own cash generation does not need to demonstrate fundraising speed, but the model scores what it can observe, and what it can observe here is capacity without recent action.
Hiring and productivity score 3 of 5, on a thinner but still grounded base. Headcount stood at approximately 8,100 employees at the end of fiscal 2025, confirmed from the annual report, split approximately 3,600 in sales and marketing and 3,900 in research and development. Revenue per employee, calculated by dividing trailing-twelve-month revenue by that headcount, comes to approximately $0.53 million per person, which the score file describes as standard for a software-as-a-service company. The qualification that matters is dated: headcount for the third quarter of 2026 is not disclosed, and the score file marks it unconfirmed. The productivity figure is therefore a calculation anchored to a year-end headcount applied to a later revenue total, an estimate built on confirmed inputs rather than a confirmed ratio in its own right. The score of 3 reflects that middle position: a productive, research-heavy workforce at a standard level of revenue per head, without the hiring surge or the exceptional productivity figure that would justify a higher mark, and without the deterioration that would justify a lower one.
Share velocity scores 4 of 5, and here the score file's treatment of evidence is at its most instructive. Gartner's Magic Quadrant for observability platforms names Datadog a Leader for a sixth consecutive year, on a press-reported basis, which is a genuine marker of competitive standing even though it is a press-reported rather than filing-confirmed claim. The filing-confirmed evidence is stronger: customers at $100,000 or more in annual recurring revenue number 4,860, up 20 percent year on year on the earnings release, and the score file associates that larger-customer cohort with a 90 percent figure for annual recurring revenue from the annual report. Remaining performance obligations of $3,847.7 million, confirmed from the quarterly report, add a forward-looking stock of contracted work to the picture of customers already won. The withheld point is a matter of method: the single-media market-share estimate of 51.82 percent is excluded because a single outlet's estimate is not a sufficient basis for a share claim, and without a verified share figure the model will not award the maximum. The reader should therefore understand the 4 as a mark for demonstrated customer accumulation and analyst recognition, not as a verified claim to majority share of the observability market. That distinction is the difference between a score built on filings and a score built on headlines, and it is one this draft is careful to keep.
4. Creative Destruction: Riding a Wave That Runs in Both Directions
Creative destruction contributes 9 of 15 points, the weakest of the three axes in relative terms, and that relative weakness is the most honest part of the assessment. The order being displaced scores 3 of 5. Datadog sits on a real substitution wave, confirmed from the Business section of the annual report: legacy monitoring built around on-premises infrastructure is being replaced by cloud-native observability, and Datadog is positioned on the replacing side of that wave rather than the replaced side. The score file, however, records a headwind that cuts against any simple story of displacement, on a press-reported basis citing Gartner through Network World: as OpenTelemetry and eBPF spread, telemetry collection itself is becoming commoditised, and switching barriers are falling. Displacement, in other words, runs in both directions. Datadog displaces the legacy order, and at the same time the standardisation of collection lowers the barrier for customers to leave Datadog itself. The score of 3 describes a displacement that is real, in progress, and limited in scope, rather than a completed revolution or a one-way rout, and it is the item where the assessment is most exposed to a future in which collection becomes a commodity and the contest moves entirely to what happens after collection.
Irreversible behaviour change scores 4 of 5, the highest creative-destruction item, and the reasoning turns on the artificial intelligence workload explosion. The score file traces a product sequence confirmed from the annual report and earnings releases: LLM Observability in 2024, Bits AI SRE in 2025, Bits Code, Bits Chat, and Agent Builder reaching general availability in 2026, and Scout 1.0, a specialized model for investigating production issues, launched in preview in the third quarter of 2026 and now powering Bits Investigation. The behaviour change at stake is a widening of the monitored object itself, from applications to models, large language models, and agents, as artificial intelligence workloads proliferate. The commercial mechanism that makes this more than a product announcement is confirmed from the quarterly report: usage-based drawdown contracts mean that rising artificial intelligence workload usage converts directly into revenue, so the behaviour change and the revenue change are the same event rather than two separate hopes. The withheld point records the one fact that prevents a maximum: the revenue contribution of the artificial intelligence products is not separately disclosed, marked unconfirmed in the score file, so the direction of the change is certain while its measured scale is not. A reader should therefore treat this item as a well-evidenced direction with an unmeasured magnitude, which is exactly how the score treats it.
Cost-structure change scores 2 of 5, the lowest item in the whole assessment, and the low mark is a deliberate correction to a tempting overclaim. Usage-based pricing, confirmed from the quarterly report, charges on the basis of hosts, custom metrics, and ingestion volume, and that is a genuine change in how customers pay. It is not, however, a collapse in unit cost, and the score file refuses to confuse the two. The Gartner observation cited on a press-reported basis, that OpenTelemetry and eBPF are lowering the cost barrier for collection across the whole industry, describes an industry phenomenon rather than a Datadog-specific cost-structure change, and it cannot be credited to Datadog alone. No company-published measured figure for its own cost change is disclosed, marked unconfirmed. The score of 2 therefore says something precise: the pricing mechanism has changed, the industry's collection cost floor is falling, but Datadog has not demonstrated a proprietary collapse in the unit cost of its own service, and the model will not award creative-destruction points for a change in billing format dressed up as a change in economics.
5. Deductions and Risks: A Clean Balance Sheet and a Concentrated Vote
Demerits total only negative 2 points, and the smallness of that number is itself a finding: none of the classic sources of fragility that the model watches for, debt distress, revenue-quality failure, or regulatory sanction, currently applies to Datadog with any force. Debt scores 0, on confirmed figures of unusual clarity. Total borrowings of $986.6 million, measured as the book value of convertible notes on XBRL data, amount to approximately 0.23 times trailing-twelve-month revenue on an estimate, while cash, cash equivalents, and marketable securities of $5,233.6 million, confirmed, leave net cash of approximately $4.25 billion on a calculation from those confirmed figures. Quarterly interest expense of approximately $1 million, confirmed, is negligible against that position. No large purchase commitments are disclosed in the annual report. The score file calls this effectively unlevered, and the description is fair: there is no debt trigger in this assessment, and the balance sheet is a source of resilience rather than a source of risk. Revenue quality also scores 0, on the filing record: no history of revenue restatement, auditor change, or audit-opinion issue, and no unusual non-recurring items, both confirmed from the disclosure record. Regulation and social cost likewise score 0, because the fiscal 2025 annual report contains no disclosure of material litigation, and no regulatory issue is confirmed. Three of the four demerit items are therefore clean, and the cleanliness is confirmed rather than assumed.
The single demerit, governance at negative 2 of a possible negative 5, is where the risk analysis concentrates, and it deserves more attention than its size suggests because it is structural rather than episodic. The company operates a dual-class share structure confirmed from the definitive proxy statement dated 2026-04-29: Class A shares carry one vote each, while Class B shares carry ten votes each. The two founders together hold 32.8 percent of voting power on a calculation from that proxy statement, with Pomel at 17.3 percent and Lê-Quôc at 15.5 percent. The board is staggered across three classes, also confirmed. Those three facts together mean that voting control is concentrated in operating founders to a degree that ordinary shareholders cannot readily overturn, and the score file explicitly calibrates the deduction against a peer, noting that the concentration here is more concrete than the case that earned a negative 1 elsewhere, which is why Datadog earns negative 2. The score file also records a loose end that the third-quarter 2026 quarterly report resolves: the company completed its conversion from a Delaware corporation to a Nevada corporation on April 21, 2026, confirmed in the filing. A reincorporation is not in itself a demerit, and the score file does not treat it as one, and with the date and form of the change now confirmed, the item is closed rather than carried forward.
Beyond the scored items, the score file lists concerns that a reader should weigh alongside the score rather than inside it. The artificial intelligence product line's revenue contribution is undisclosed, so the second curve remains qualitative. The commoditisation of telemetry collection, flagged by Gartner on a press-reported basis, threatens to thin the moat from below even as the product line widens above. The score sits one point above the threshold, so a single downward item revision would take it back to the line. And a chief executive Rule 144 sale plan covering 127,141 shares, on a press-reported basis, is recorded as a concern in the score file. That last item is not a scored demerit, and this draft does not treat it as one: executive sale plans have many possible explanations, and the score file offers no filing-confirmed interpretation. It is recorded here because the score file records it, labeled as press-reported, and because a reader assessing a threshold score is entitled to know every concern the scorer noted, including those the scorer chose not to score.
Stepping back from the item scores, the risk picture resolves into the score file's own framing of the blitzscaling fit. Datadog's main growth lever is distribution, through land-and-expand, with platform extension as the secondary lever, from observability into security and then into artificial intelligence observability, and with network effects as the weak lever. That is a software blitz of a different kind from the heavy-infrastructure blitzes the model also scores: no factories, no fleets, no hardware lead times, but a product that can be adopted in hours and expanded by usage. The trade-off between speed and efficiency, which the blitzscaling playbook usually presents as a painful choice, is handled here in the model's most favourable form. Sales and marketing share fell while growth re-accelerated, GAAP operating margin turned positive at 6.2 percent in the third quarter, and the free cash flow margin of approximately 29 percent, estimated, suggests a business generating cash even while its accounting operating profit is thin. The score file calls this a blitz without burning, and the phrase is apt as far as it goes. The single largest failure point the score file identifies is also the most elegant: if collection becomes a commodity, analysis is everything. Datadog's moat must therefore migrate, visibly and measurably, from collecting telemetry to analysing it, automating responses to it, and generating artificial intelligence insight from it. If the artificial intelligence product line proves that migration in revenue terms, the moat deepens. If it does not, the moat is wide but shallow, and the commoditisation headwind will keep eroding it from below.
6. What to Watch
Several observable markers will determine whether this 66/B rises, stays level, or falls back to the threshold, and each of them is already named in the score file's evidence rather than invented for this draft. The first and most consequential marker has now been observed: the third-quarter 2026 earnings release, reported before the market opened on 2026-11-04, delivered revenue of $1,197.1 million, up 35.2 percent year on year, above the guided range of $1.135 to $1.145 billion, extending the run above 24 percent to a thirteenth quarter and lifting the growth item to 9. The baseline for the next quarter is therefore thirteen quarters above 24 percent, 2026 growth of 32.2, 35.6, and 35.2 percent, and fiscal 2026 guidance of $4.515 to $4.525 billion. The second marker is disclosure of artificial intelligence revenue contribution. Any separate disclosure of what the artificial intelligence observability products contribute would convert the second curve from a qualitative candidate into a measured one, and could strengthen both the behaviour-change item and the Gate 1 second-curve case. Continued non-disclosure would not by itself lower the score, but it would leave the most important strategic claim in the assessment unmeasured for another quarter, and the burden of proof would grow heavier rather than lighter.
The third marker was the governance loose end. The Nevada reincorporation is now confirmed as completed on April 21, 2026, so that check item is closed; the new item to watch is the quarterly report's note that usage from the largest customer fell in the third quarter of 2026, which the score file carries as the next-quarter check. The fourth marker is the commoditisation headwind itself. Evidence that switching barriers are continuing to fall, or conversely that multi-product adoption and retention are holding at the levels recorded here, 86 percent for two or more products, 61 percent for four or more, 41 percent for six or more, and net revenue retention in the low 120 percent range, will show whether the ecosystem lock-in is deepening or thinning. The fifth marker is the profit picture underneath the gross margin. A GAAP operating margin that turned positive, at negative 1.3 percent for fiscal 2025, positive 0.5 percent for the second quarter of 2026, and positive 6.2 percent for the third quarter, alongside a free cash flow margin estimated at approximately 29 percent, describes a company whose economics are strong at the gross line and thin at the operating line; movement in either direction would clarify whether the withheld moat points are reachable or whether the thin operating margin is structural. Finally, the valuation note, which the model deliberately excludes from the score, records a market capitalisation of approximately $100 billion on a press-reported basis as of 2026-10-14 and a price-to-sales ratio of approximately 26 times trailing-twelve-month revenue of $4.28 billion. The business score does not look at price, following the lesson of the model's earlier testing that a business score and a market price measure different things, but a reader who wants the distance between the business assessment and the market's pricing of it will find that figure here, labeled as press-reported and kept separate from the score. Datadog at 66/B is, in the end, a portrait of a mature company that declined to mature quietly: thirteen quarters without slowing, a distribution engine that grows more efficient as it grows faster, a moat built on integration depth rather than network breadth, a balance sheet with almost nothing to deduct, and a single question hanging over all of it, whether the artificial intelligence product line is the second curve that keeps the re-acceleration going or the extension that merely decorates the first.
Head-to-head
Datadog vs Snowflake — side-by-side scorecard comparison.
More Platforms companies
Other Platforms names on the Blitz Index, highest score first: Alphabet (83/A), Meta (78/B), Airbnb (76/B).
Next earnings
Q4 2026 · Expected
Coverage
Datadog, Inc. · Q3 2026 reported Nov 4, 2026 · Score 66 · Grade B · 65+ Club member
Embed this score
Copy the HTML below to show this score on your site. The badge links back to this page and updates automatically when the score changes.
Preview:
BlitzLab scores businesses against a scholar’s standard — not investment advice. No price targets, no buy/sell recommendations. Figures are from SEC filings (XBRL) as labeled in the source scorecard.