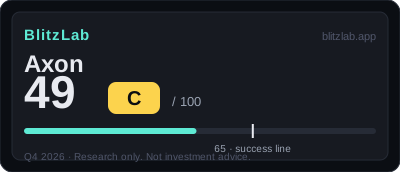
Axon — Blitz Index 49 (C)
10 straight quarters above 30% growth — but the accountants keep rewriting the past.
Last re-scored: November 5, 2026.
Confidence: High · S&P 500 · Category: platforms
Score breakdown
| Section | Score | Detail |
|---|---|---|
| A · Speed | 17 / 25 | Q2'26 revenue $904.4M (+35.3%) — 10 straight quarters above 30%; ARR $1.639B (+39%), NRR 126% |
| B · Moat | 31 / 60 | Evidence.com data gravity + 80%+ integration usage as switching barrier; RPO $9.9B + $15.1B future contracted bookings |
| C · Creative destruction | 10 / 15 | TASER→software→drones: AI Era Plan +700% y/y; Dedrone at $100M/quarter — the drone leg monetizing |
| D · BlitzFailing | −9 | Unresolved revenue-recognition material weakness + restatement history; 83% US revenue with non-appropriation termination clauses; FY2025 GAAP operating loss −$62.1M |
Think we scored it wrong? Score it yourself →
Radar axes (0–100): Moat 52 · Speed 68 · Creative 67.
Watch item
Gates: G1 ✓ · G2 ✓ (conditional on commercial penetration). 14 points below the threshold — an A-grade business with C-grade accounting trust.
Strengths
- 10 straight quarters of 30%+ growth, Q2'26 $904.4M (+35.3%) — sustained blitz at scale
- ARR $1.639B (+39%), NRR 126% — the SaaS engine is now the body
- RPO $9.9B + $15.1B future contracted bookings — years of visibility
- AI Era Plan +700% y/y, Draft One — AI bundle proving per-seat expansion
Concerns
- Unresolved revenue-recognition material weakness + restatement history — structural accounting discount
- 83% US revenue + non-appropriation termination clauses — political/budget cycle exposure
- FY2025 GAAP operating loss −$62.1M despite +33.5% revenue — $634M SBC drag
- Half the claimed $159B TAM (commercial/private) is weakly held — G2's real variable
Research notes
Thesis: a platform blitz whose accounting has not kept pace with its business
Axon Enterprise scores 49 out of 100, grade C, and the shape of that total matters more than the total itself. Speed scores 17 out of 25. Moat scores 31 out of 60. Creative destruction scores 10 out of 15. Deductions total 9 points. Add those together, 17 plus 31 plus 10 minus 9, and the result is 49, sixteen points below the 65-point line that BlitzLab uses as its threshold. There is no FLAG marker on this score, because the deduction total of 9 sits below the 15-point threshold at which a FLAG would apply. This is a first scoring, not a rescore, and it is dated October 18, 2026, the scoring date that the score file calls T. The latest results available at that date were the second quarter of 2026, reported on August 5, 2026. Third-quarter 2026 results had not been published before T, are excluded from the score, and appear in this body only as a future marker, with no anticipated outcome attached.
The central tension of the score is easy to state and hard to resolve. On the operating evidence, Axon looks like a company in the later stages of a first blitz that is changing its own centre of gravity, from hardware dominance toward a software platform. Revenue has grown by more than 30 percent for ten consecutive quarters. Annual recurring revenue reached $1.639 billion. Remaining performance obligations, the contracted revenue backlog the company reports, stood at $9.9 billion, and a broader measure the company reports, future contracted bookings, stood at $15.1 billion. The moat section, however, scores only 31 out of 60, and the reason is structural rather than a matter of execution in any single quarter: Axon's lock-in is a government-procurement lock-in, powerful within a contract cycle and exposed again at every rebid. The deductions section then adds a second, different kind of tension. The sharpest deduction in the whole scorecard is not debt, governance, or regulation. It is revenue quality, at minus 5 points, because a material weakness in revenue recognition remained unresolved at December 31, 2025, and because the 2023 and 2024 financial statements were restated. A reader who wants to understand the score of 49 should hold both halves in view at once: a business whose growth, retention, and contracted backlog are demonstrably strong, and a set of financial-reporting controls whose weakness is documented in the company's own annual report. The score file's own summary of the largest single blitzscaling risk puts it in one sentence: the accounting has not kept pace with the business. This body follows that framing, because it is the framing the evidence supports.
Axon was formerly TASER International and changed its name to Axon Enterprise in 2017. The score file classifies it as a growth company, with trailing-twelve-month revenue of approximately $3.22 billion and a market capitalisation of approximately $33 billion. Both gate verdicts pass, but they pass in very different ways, and the difference between them previews the whole score. Gate 1, which asks whether growth continues or a second growth curve exists, passes on confirmed evidence: ten consecutive quarters of growth above 30 percent, annual recurring revenue growth of 39 percent year over year, a net revenue retention rate of 126 percent, and a raised full-year 2026 revenue growth guidance of 32 to 34 percent. Gate 2, which asks whether the ten-year ceiling of the new market is at least ten times current revenue, passes only as a borderline estimate. The bar implied by trailing-twelve-month revenue of $3.219 billion is approximately $32.2 billion. The company presents a total addressable market of $159 billion, split evenly between law enforcement and enterprise and private customers, in a third-quarter 2025 investor deck cited in the score file as press-reported. The score file does not accept that figure at face value. It discounts the enterprise and private half, where Axon's position is weak, and it records the pass as borderline, with private-sector penetration and the revenue contribution of drones as triggers for re-examination. That caution runs through the rest of the score, and it is a strength of the scoring rather than a hedge: the parts of the story that are confirmed in filings are treated as confirmed, and the parts that rest on company presentation or estimation are labelled as such.
Speed: sustained high speed at a scale where speed is supposed to fade
Speed scores 17 out of 25, or 68.0 on the radar conversion, and it is the strongest section in percentage terms. Its four items are growth at 7 out of 10, capital velocity at 4 out of 5, hiring and productivity at 3 out of 5, and share velocity at 3 out of 5. The growth item carries the section, and the figures behind it describe a company growing fast not for one quarter but across a full cycle of quarters and across three fiscal years. Revenue rose from $1,560.7 million in fiscal 2023 to $2,082.5 million in fiscal 2024, an increase of 33.5 percent, and then to $2,779.5 million in fiscal 2025, again an increase of 33.5 percent. Those annual figures are confirmed in the company's filings with the United States Securities and Exchange Commission. The quarterly sequence that follows them is a mixture of confirmed and press-reported figures, and this body preserves that mixture: revenue of $711 million in the third quarter of 2025, up 31 percent; $797 million in the fourth quarter of 2025, up 39 percent; $807 million in the first quarter of 2026, up 34 percent; and $904.4 million in the second quarter of 2026, up 35.3 percent. Together with the earlier quarters, that sequence makes ten consecutive quarters of growth above 30 percent. The score file's judgement on the growth item is precise, and it is worth quoting in substance: growth of this consistency at a revenue scale approaching $2.8 billion is among the best measured in this scorecard, but it is steady high speed rather than explosive acceleration, and the top three points are withheld for that reason. The discipline of that withholding matters, because it shows the score is not grading on enthusiasm. A company growing at 33 to 35 percent year after year is growing very fast. It is not, on this evidence, accelerating away from its own trend, and the score of 7 rather than 10 records exactly that distinction.
The recurring-revenue figures behind the growth item are what turn a run of strong quarters into a claim about the shape of the business. Annual recurring revenue rose from $1.0 billion in December 2024 to $1.639 billion at June 30, 2026, an increase of 39 percent year over year. Net revenue retention rose from 124 percent to 126 percent. Future contracted bookings, the broader measure of contracted work the company reports, reached $15.1 billion, up 41 percent. Full-year 2026 revenue guidance was raised to growth of 32 to 34 percent. Guidance is a stated expectation, not a result, and this body treats it as such. What has already happened, and what carries the growth score, is the ten-quarter run, the annual recurring revenue level and its growth rate, and the retention rate. Those are the confirmed and press-reported facts, and they point in the same direction: the growth is not a single product cycle or a single large contract. It is a recurring-revenue engine expanding within an existing customer base as well as by adding new customers, which is the distinction the moat section will return to.
Capital velocity scores 4 out of 5, and the evidence is access to capital on terms that are workable rather than cheap in every respect. In March 2025 the company issued $1.75 billion of senior notes, in two tranches carrying coupons of 6.125 percent and 6.25 percent, as confirmed in filings. In September 2026 it added a $1.15 billion zero-coupon convertible note, with a conversion price of $652.06, also confirmed in a filing dated September 15, 2026. Remaining performance obligations of $9.9 billion underpin future growth in the score file's reading, because contracted backlog is a claim on future revenue that does not depend on winning every next sale from scratch. The other side of the capital picture is the share price, and the score file records it without letting it change the business score: the share price was down 31.3 percent year to date and down 41.8 percent over one year at the time of scoring, with the price cited at $390 against a 52-week high of $764. Those price figures come from a market-data source dated October 16, 2026, and they are recorded here as market context. The capital-velocity score of 4 describes a company that can raise debt capital, including a zero-coupon convertible instrument, while its share price has fallen sharply from its high. Fundraising in this scorecard is debt-led, a point the deductions section takes up under the debt item, but the interest burden is assessed there as manageable, and the capital-velocity score reflects access rather than cost alone.
Hiring and productivity score 3 out of 5, the most conservative item in the speed section, and the reason is the character of the business rather than any sign of stalled hiring. Headcount was more than 5,100 at December 31, 2025, confirmed in the annual report, and was reported at 6,300 by October 2026 on a press-reported basis. Revenue per employee in fiscal 2025 was approximately $545,000. That figure is low compared with a pure software company, and the score file is explicit about why: Axon combines hardware manufacturing with public-sector sales, both of which are people-intensive in ways that pure software is not. Hiring continues, but the productivity evidence is not strong enough for a higher mark, and the score of 3 records that judgement without penalising the company for being in a hardware-plus-services business. A reader should not compare the $545,000 figure directly with a pure software peer and conclude that Axon is inefficient; the score file's point is narrower, that within this scorecard's productivity lens, the evidence supports a middle mark rather than a high one.
Share velocity scores 3 out of 5, and here the picture is dominance at home with limited reach abroad. United States revenue accounts for 83 percent of the total, confirmed in filings, which means overseas revenue is only 17 percent. The company claims a share of approximately 2 percent against its $159 billion total addressable market figure, a press-reported claim that the score file records without adopting as a measured market share. What is measured, rather than claimed, is the position within law enforcement: body cameras, TASER devices, and the Evidence.com platform are described in the score file as effectively the standard in their category, although a quantified market share figure is unconfirmed. Two newer axes of share expansion are recorded as in progress rather than complete. The AI Era Plan, an artificial-intelligence bundle sold per seat, grew revenue by 700 percent year over year in the second quarter of 2026. Dedrone, the drone and counter-drone business acquired by the company, recorded a quarter of $100 million in revenue. Both figures are press-reported in the score file's sourcing. The score of 3 therefore describes a company that dominates its home market and its core category, is expanding into adjacent categories, and has not yet demonstrated the overseas or private-sector share that would justify a higher mark. The 83 percent domestic concentration is both the evidence of dominance and the limit on the score, and the gate discussion in the next section explains why.
Moat: a government-procurement lock-in, powerful and capped
The moat section scores 32 out of 60, or 53.3 on the radar conversion, and its four items are network effects at 8 out of 18, distribution scalability at 9 out of 18, market size at 8 out of 12, and gross margin at 7 out of 12. The shape of that split is the analytical core of the Axon case. The company has built something difficult to displace within its customer base, in a market large enough to matter, with a gross margin structure that is stable rather than expanding. But it has not demonstrated the self-reinforcing, viral network effect that the strongest moats in this scorecard possess, and its distribution advantage is constrained by the structure of public procurement itself. The score file names the resulting form precisely: a business-to-government lock-in moat, a variant of a network effect rather than the consumer form of one. Understanding that variant is the key to understanding why two moat items sit at the top of their middle anchor bands rather than higher.
Network effects score 8 out of 18, at the top of the 5 to 9 anchor band for data and ecosystem effects. The evidence is the gravitational pull of Evidence.com, the company's digital evidence-management platform. More than 80 percent of customers use hardware and software together, and more than 40 percent use premium subscriptions, both figures press-reported. Net revenue retention of 126 percent is driven not by price increases but by expansion in modules per seat, with Draft One and the AI Era Plan named as the drivers. Acquisitions have extended the platform's axes: Fusus, Dedrone, and Carbyne are all recorded in filings as additions to the platform rather than as standalone businesses. The score file cites a $625 million figure alongside Carbyne in its gate discussion; this body records that figure as cited in the score file without characterising its precise transaction structure, because the score file does not specify it in the passage cited. The constraint on the network-effects score is structural, and the score file states it plainly: public procurement operates through competitive bidding, so a contract can be contested again at renewal. Evidence.com creates data gravity, because evidence accumulated on the platform is costly and disruptive to move, and because workflows built around it embed the platform in daily operations. But that gravity operates within a rebid ceiling. It is not the kind of network effect in which each additional user automatically makes the product more valuable to every other user, as in a consumer network. It is a lock-in that must be re-earned contract by contract, and the score of 8, at the top of its anchor band but far from the section maximum of 18, records exactly that qualified strength.
Distribution scalability scores 9 out of 18, also at the top of its anchor band, for paid and sales-dependent distribution that nevertheless expands repeatedly. The evidence for expansion is the land-and-expand pattern itself: net revenue retention of 126 percent, driven by additional modules, is distribution working inside the installed base. The constraints are documented in the company's own annual report, in its risk-factor disclosure, which the score file paraphrases in substance: most end customers are subject to budget and political constraints, and government contracts carry non-appropriation termination provisions, meaning a contract can be ended if funds are not appropriated. Remaining performance obligations of $9.9 billion are counted only where the contract definition under the accounting standard ASC 606 is met, but the score file notes that the split between funded and unfunded amounts is not disclosed. That undisclosed split matters for reading the $9.9 billion figure honestly: it is a contracted backlog under an accounting definition, not a guarantee that every dollar is already funded. Overseas expansion is under way, with the overseas share rising from 15 percent to 17 percent, and a deal involving 200,000 police officers in Italy cited as an example of that expansion. The score of 9 therefore describes distribution that demonstrably expands, through a public-sector sales channel the company has mastered, within limits that the channel itself imposes. A higher score would require evidence that distribution compounds without the same sales effort at each renewal, and the rebid structure is precisely what prevents that claim.
Market size scores 8 out of 12, and the reasoning here is the gate reasoning carried into the section score. The bar is approximately $32.2 billion, ten times trailing-twelve-month revenue of $3.219 billion. Reaching that bar over ten years requires compound annual growth of approximately 26 percent. Current guidance of 32 to 34 percent sits above that required rate, so the trajectory is arithmetically reachable even with deceleration, but the score file does not treat that arithmetic as a forecast. The company's 2028 revenue target of $6 billion is only 19 percent of the bar, which means that after 2028 a further roughly fivefold increase would still be needed within the ten-year horizon. The company's $159 billion total addressable market figure is discounted because half of it, the enterprise and private half, rests on a weak position. Drones and next-generation 911, the NG911 category into which Carbyne extends the company, are the newer axes that could expand the reachable market, but their revenue contribution is still small. Platform Solutions revenue grew 122.6 percent, and Dedrone recorded a $100 million quarter, but those figures describe the beginning of an axis rather than a mature second market. The score of 8, rather than the maximum of 12, is reserved for the moment when private-sector penetration and the drone axis are demonstrated in revenue at a scale that changes the market-size arithmetic. Until then, market size is a pass with a visible path, not a proven expanse.
Gross margin scores 7 out of 12, and it is the moat item where stability, not expansion, is the story. Consolidated gross margin was 60.1 percent in fiscal 2023, 59.7 percent in fiscal 2025, and 60.4 percent in the second quarter of 2026, all confirmed in filings. That is a margin held in a narrow range around 60 percent across three years, not a margin expanding toward software levels. The segment split explains why. Software and Services gross margin was 74.0 percent in fiscal 2025, while Connected Devices gross margin was 48.7 percent, a gap of more than 25 percentage points. As the software share of revenue rises, the consolidated margin should, in principle, rise with it. In practice, the hardware mix, new products, and tariffs have offset that uplift, holding the consolidated figure flat. The score file makes a further distinction that a reader should preserve: fiscal 2025 showed a GAAP operating loss of $62.1 million, and the cause named in the score file is stock-based compensation of $634 million. That loss is therefore not, in the score file's reading, evidence that the underlying margin structure has failed; it is evidence that the cost of paying people in equity, at the scale Axon does, overwhelms the operating result on a GAAP basis. The margin-structure judgement and the operating-leverage judgement are separated in the score file, and the gross-margin score of 7 reflects the margin structure alone: a strong, stable, hardware-diluted margin, not yet a software margin.
Creative destruction: replacing paperwork, on-premises storage, and the patrol car
Creative destruction scores 10 out of 15, or 66.7 on the radar conversion. Its three items are replacing the existing order at 4 out of 5, irreversible behaviour change at 3 out of 5, and cost-structure change at 3 out of 5. Together they describe a displacement that is specific and observable, rather than a general claim about transformation. Axon is not replacing one consumer habit with another. It is replacing particular workflows inside law enforcement and emergency response, one at a time, with platform equivalents. The specificity of that displacement is its strength, and the incompleteness of it is why no item reaches its maximum.
Replacing the existing order scores 4 out of 5, and the targets of replacement are named concretely in the score file. Draft One converts body-camera audio into a police report automatically, replacing the manual work of writing reports from recordings and notes. Evidence.com replaces on-premises evidence storage, moving the storage and management of digital evidence from servers an agency owns and maintains to a cloud platform the company operates. Carbyne replaces legacy 911 systems with cloud-based next-generation 911. Drone first response places a drone at a scene before a patrol car, replacing the patrol-car-first dispatch order with a drone-first order for appropriate calls. Each of those is a clear, large target, and that clarity is why the score is 4. The fifth point is withheld for a specific reason recorded in the score file: demonstrated completion of the replacement. Draft One assists report writing, Evidence.com hosts evidence, NG911 is being adopted, and drone first response is being deployed, but none of those displacements is shown as complete across the market. Replacement is well under way in each category, and complete in none of them as a market-wide fact. A reader should resist turning a 4 into a claim of victory; the score file's own condition for the fifth point is completion, and completion is not the evidence presented.
Irreversible behaviour change scores 3 out of 5, and the evidence is the structure of the contracts rather than any single anecdote about changed habits. Remaining performance obligations of $9.9 billion and future contracted bookings of $15.1 billion represent multi-year commitments that lock an agency's evidence, reporting, and dispatch workflows to the platform for the contract term. Annual recurring revenue of $1.639 billion, with the services share of revenue rising to 43.3 percent, shows the software transition progressing inside the revenue mix: the more an agency's spending sits in recurring services rather than one-off hardware, the more its daily operations depend on the platform continuing to function. The reason the score stops at 3 is the same rebid ceiling that capped the moat items. Public procurement means that at renewal, an agency can choose differently, and the score file is explicit that full irreversibility is not established. Multi-year lock-in is real, and it is structural rather than merely habitual, but it is term-limited by design. The score of 3 holds those two facts together: behaviour has changed in a way that is costly to reverse within a contract, and it has not been shown to be irreversible beyond the contract cycle.
Cost-structure change scores 3 out of 5, and here the evidence is the most forward-looking and therefore the most carefully labelled in the score file. The artificial-intelligence bundle, the AI Era Plan, which grew 700 percent year over year, is presented as structurally lowering the workflow cost per officer, because report generation and related tasks that previously consumed officer time are increasingly automated. Drone first response is presented as displacing patrol dispatch costs, because a drone can reach a scene and establish situational awareness before a patrol car is committed. Both are plausible mechanisms of cost-structure change, and both are recorded as press-reported in the score file. The reason the score stops at 3 is that the completed demonstration of a cost-structure collapse is not present, and a countervailing pressure is recorded in the same item: tariff and memory-cost pressures, with margin pressure in the third quarter of 2026 flagged by the company in advance. That flag is a company preview, not a result, and this body attaches no outcome to it; third-quarter 2026 results were not published before T and are excluded from the score. The point for the cost-structure item is narrower: at the scoring date, the mechanisms of cost reduction are demonstrated as products and growth rates, the economy-wide cost pressures working against them are acknowledged by the company, and the completed, market-wide collapse of the old cost structure is not yet the evidence. A score of 3 records a change in progress, not a change completed.
Deductions and risks: the accounting item dominates, and it should stay prominent
Deductions total 9 points: debt at minus 3, revenue quality at minus 5, governance at 0, and regulatory and social costs at minus 1. The total is below the FLAG threshold, and the score carries no FLAG marker. But the distribution of those 9 points matters far more than the total, because one item accounts for more than half of them, and that item goes to the trustworthiness of the numbers on which the rest of the score rests. A reader who skips this section will misunderstand the score. A reader who reads only this section will misunderstand it in the opposite direction. Both halves are needed, and the score file keeps them in proportion: the business sections total 60 points before deductions, which is a strong business score, and the deductions remove 9 of them, leaving 51. The question this section answers is not whether the business is weak. It is which risks are structural, which are manageable, and which one is not yet resolved.
Revenue quality, at minus 5 out of a possible minus 10, is the sharpest deduction in the scorecard, and it must not be softened. As of December 31, 2025, a material weakness in revenue recognition remained unresolved, disclosed in Item 9A of the fiscal 2025 annual report. The score file records, as confirmed in that filing, that the weakness caused non-trivial errors in the 2023 and 2024 disclosures of revenue, contract assets and liabilities, and remaining performance obligations. The 2023 and 2024 financial statements were restated. A separate material weakness relating to convertible notes was resolved by June 30, 2026, but the revenue-recognition weakness was not. The score file draws an explicit distinction with a prior case in this scorecard, and that distinction is important for calibrating the deduction. In the SMCI case, the matter closed without a restatement, with an internal-control weakness remaining. In Axon's case, there is both a restatement history and an unresolved revenue-recognition weakness, which the score file treats as a more direct trigger for the revenue-quality deduction. The background items recorded alongside the deduction, a Dedrone patent lawsuit and the non-appropriation termination provisions in government contracts, are context, not the substance of the item. The substance is the controls finding itself. The score file's own analysis of the largest blitzscaling risk returns to this point: blitzscaling theory includes a rule about deciding from data, and in Axon's case the data itself, the revenue and backlog disclosures, contained errors. That is why the deduction is minus 5 rather than a smaller figure, and why its resolution, if it comes, would matter arithmetically as well as substantively: removing a 5-point deduction would, on its own and with all else unchanged, move the total from 51 to 56. That arithmetic is a property of the score, not a prediction about any future filing, and this body states it only in those terms.
Debt, at minus 3 out of a possible minus 10, is a moderate deduction, and the figures show why it is not larger and why it is not zero. Long-term borrowings were $1.81 billion at December 31, 2025, confirmed in filings, and the September 2026 zero-coupon convertible note of $1.15 billion brings the combined figure to approximately $2.96 billion, approximately 0.9 times trailing-twelve-month revenue. Fiscal 2025 interest expense was $94.2 million, which the score file assesses as manageable. The debt itself is therefore light relative to revenue, and a reader who looked only at the borrowing total might wonder why there is any deduction at all. The answer lies on the other side of the item, in stock-based compensation. Annual stock-based compensation is cited at $590 million to $620 million in the fiscal 2026 guidance, approximately 20 percent of revenue, and fiscal 2025 stock-based compensation was $634 million. The score file draws a parallel with a prior case, ZS, where a stock-based compensation level of 24.5 percent of revenue also drew a minus 3 deduction. Shares outstanding rose from 76.6 million to 80.2 million, an increase of 4.7 percent per year. The deduction is therefore best understood as a dilution-structure deduction that sits inside the debt item: the borrowing is manageable, but the equity cost of paying for speed is structural, and it dilutes existing holders year after year at a rate approaching 5 percent. A score of minus 3 records a capital structure that is not distressed and not clean, and the distinction between those two descriptions is the whole point of the item.
Governance, at 0 out of a possible minus 5, is the only deduction item with no deduction, and the evidence is unusually clean for a founder-led company. Founder and chief executive Patrick Smith, known as Rick Smith, holds 3.5 percent of shares. Vanguard holds 11.6 percent and BlackRock holds 9.3 percent. The company has a single class of common shares, has issued no preferred shares, and has no dual-class voting structure, all confirmed in the definitive proxy statement filed on April 16, 2026. The quantitative governance anchor for differential voting therefore finds no basis for a deduction, and the score is 0. That zero is not a judgement that governance is perfect in every respect; it is a judgement on the specific anchor the model measures, which is differential voting control. Within that anchor, Axon is the opposite of a controlled company: the founder's stake is small, institutional holders are the largest holders, and no share class carries superior votes. A reader comparing this scorecard with others in which governance deductions are large should note the contrast, because it shows the model differentiating rather than penalising founder-led companies as a category. The zero here is earned by the share structure, and the score file records it as confirmed rather than estimated.
Regulatory and social costs, at minus 1 out of a possible minus 5, is a small deduction for a risk that is early rather than realised. The item records a regulatory movement around bias in artificial-intelligence reporting, in the form of Utah Bill SB180, cited in the score file as press-reported and explicitly not yet legislation. No securities litigation and no confirmed fines are recorded. The score file also records, as a valuation note rather than a score driver, a price-to-earnings ratio of 166 times and a fall of 49 percent from the 52-week high. Those valuation figures are not part of the score, and this body repeats them only in that labelled capacity: as valuation context, not as score drivers. The business score in this model deliberately does not look at price, a principle the score file traces to an earlier test in this scorecard's history. The deduction of minus 1 therefore reflects a single, pre-legislative regulatory movement, with no realised litigation or penalty behind it. It is a watch item, not a realised cost, and the small size of the deduction records that status accurately. If the bill were enacted, or if litigation or penalties were confirmed, the item would need to be revisited; at the scoring date, neither had happened on the evidence in the score file.
Two further valuation-context figures, also explicitly excluded from the score, are worth recording in the same labelled capacity so that a reader does not mistake the business score for a market judgement. Market capitalisation was approximately $33.2 billion at October 16, 2026, the price-to-earnings ratio on a trailing-twelve-month basis was 166.5 times, and the 52-week price range was $339.01 to $764.02, with the year-to-date change at minus 31.3 percent. Those figures come from the score file's valuation note and from a market-data source dated October 16, 2026. They describe how the market was pricing the company at the scoring date, and they sit alongside a business score that does not use them. The juxtaposition is informative without being a judgement: a business scoring 51 on this model, with a strong speed section and a material weakness in revenue recognition, was priced at a multiple that implies expectations well above the current business score. Whether that pricing proves demanding or generous is not a question this scorecard answers, and this body does not attempt to answer it. The score is a measure of the business against a blitzscaling standard. The valuation figures are context for how the market, at one date, was valuing that business. Keeping the two separate is a discipline of the model, and this body preserves it.
What to watch: the tests that will move this score
The score file identifies three key drivers, and they translate directly into what a reader should watch in future filings. The first is the simplest to state and the most consequential for the total: whether the revenue-recognition material weakness is resolved. That single item accounts for 5 of the 9 deduction points, and it is the only deduction item whose resolution is framed in the score file as a discrete, observable event: a future annual report either continues to disclose the weakness or states that it has been remediated. The business sections do not need to improve dramatically for the total to rise; the arithmetic of the score means that removing a deduction moves the total by the same amount as gaining the same number of points in a business section. But the significance of resolution would go beyond arithmetic. A revenue-recognition weakness goes to the reliability of the revenue, contract-asset, and backlog figures on which the growth, retention, and moat judgements partly rest. Its resolution would therefore strengthen the evidentiary basis of the score as well as the total. Its persistence, by contrast, would keep a structural discount on an otherwise strong business score, and would keep the score file's central risk statement intact: the business is moving faster than the controls that report it. Either way, the judgement will come from a filing, not from expectations formed in advance, and the third-quarter 2026 results, which were not published before T, are not the filing that answers this question, since the weakness is assessed at a fiscal year-end. The relevant future marker is the next annual report's internal-control disclosure, and this body attaches no anticipated outcome to it.
The second test is the private-sector and drone question that sits behind the borderline Gate 2 pass. The company's $159 billion market figure is discounted in the score precisely because half of it, the enterprise and private half, rests on a weak position, and the score file names private-sector penetration and the revenue contribution of drones as triggers for re-examination. The figures to watch are therefore not the total addressable market claim, which the score file already discounts, but the demonstrated revenue: the overseas share, currently 17 percent against 83 percent domestic; the private-sector revenue, which the score file treats as the true variable for the gate; and the drone axis, where Dedrone's $100 million quarter and Platform Solutions growth of 122.6 percent are the starting points. If those axes grow into a material share of revenue, the market-size score of 8 and the borderline gate pass both gain evidentiary support. If they stall, the gate pass remains borderline and the market-size score remains capped, regardless of how fast the core law-enforcement business grows. The distinction matters because the core business, however strong, has a ceiling defined by the law-enforcement market, and the gate arithmetic requires a market roughly ten times current revenue. That arithmetic can only be satisfied by axes beyond the core, and the score file is explicit that those axes are not yet proven at scale.
The third test is the platform transition itself: whether the software share of revenue continues to rise, and whether the consolidated gross margin follows it. Services already account for 43.3 percent of revenue, annual recurring revenue is $1.639 billion, and the Software and Services gross margin of 74.0 percent stands more than 25 percentage points above the Connected Devices margin of 48.7 percent. The arithmetic of that transition is favourable: every point of revenue mix shifted from devices to software should, in principle, lift the consolidated margin from its current range around 60 percent. In practice, hardware mix, new products, and tariffs have held it flat across fiscal 2023, fiscal 2025, and the second quarter of 2026. The test for future quarters is therefore whether the mix effect finally outweighs the offsets, or whether the offsets persist. A related test sits alongside it, in the cost of paying for the transition: stock-based compensation at approximately 20 percent of revenue, and $634 million in fiscal 2025, is the structural cost that produced a GAAP operating loss of $62.1 million in a year when revenue grew 33.5 percent. The question for future filings is whether that cost moderates as a share of revenue as the company scales, or whether it remains a permanent roughly one-fifth claim on revenue. Neither outcome would change the growth score on its own, but the first would ease the debt-item deduction's dilution logic, and the second would keep it in place. Both are observable in filings, in the stock-based compensation line and the share count, and neither requires any judgement in advance.
Axon's score of 49, grade C, sixteen points below the 65-point line, is best read as a portrait of a company mid-transition, with the evidence for each half of the portrait drawn from different kinds of source. The growth half is confirmed in filings: ten consecutive quarters above 30 percent, annual recurring revenue of $1.639 billion growing 39 percent, net revenue retention of 126 percent, and a contracted backlog of $9.9 billion. The moat half is qualified by structure: a platform lock-in that is powerful within a contract and contestable at renewal, a distribution channel that expands repeatedly but cannot compound without re-winning, and a market-size case that depends on axes not yet proven at scale. The deductions half is dominated by a single unresolved item: a revenue-recognition material weakness, with a restatement history, that no strength in the business sections can offset until a future annual report shows it remediated. A company that resolves that item, demonstrates private-sector and drone revenue at scale, and converts its software mix into a rising consolidated margin would look, on this scorecard, like a materially different company from the one scored at October 18, 2026. A company that does not would remain, on the same scorecard, a strong and fast business whose reported numbers carry a documented discount. Until the relevant filings arrive, the honest summary is the score itself: speed 17, moat 31, creative destruction 10, deductions 9, total 49, grade C, no FLAG, sixteen points below the line, with the sharpest single fact in the file being the one that most needs to change.
More Platforms companies
Other Platforms names on the Blitz Index, highest score first: Alphabet (83/A), Meta (78/B), Airbnb (76/B).
Next earnings
Q4 2026 · Expected
Coverage
Axon Enterprise, Inc. · Q3 2026 due Nov 5, 2026 (AMC, confirmed) · Score 49 · Grade C
Embed this score
Copy the HTML below to show this score on your site. The badge links back to this page and updates automatically when the score changes.
Preview:
BlitzLab scores businesses against a scholar’s standard — not investment advice. No price targets, no buy/sell recommendations. Figures are from SEC filings (XBRL) as labeled in the source scorecard.