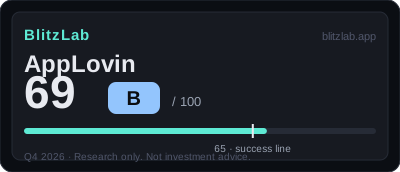
AppLovin — Blitz Index 69 (B)
An A-grade business with C-grade trust — speed the shorts don't believe.
Last re-scored: October 11, 2026.
Confidence: High · S&P 500 · Nasdaq-100 · Category: platforms
Score breakdown
| Section | Score | Detail |
|---|---|---|
| A · Speed | 21 / 25 | FY2025 $5.48B (+70%); TTM $6.83B (+~53%); $6.1M revenue per employee |
| B · Moat | 46 / 60 | MAX + AXON: 140K+ apps, 1.8B+ devices; data flywheel; GAAP GM 87.9% |
| C · Creative destruction | 11 / 15 | Manual media buying → AXON AI optimization; apps business sold, pure ad platform |
| D · BlitzFailing | −9 | Short-seller claims + 2 class actions unresolved; 67% founder voting control |
Think we scored it wrong? Score it yourself →
Radar axes (0–100): Moat 77 · Speed 84 · Creative 73.
Watch item
Gates: G1 pass · G2 pass (estimated). 4 above threshold — first-ever score. "Speed is not enough" made flesh.
Strengths
- 3 straight years of 70%+ growth; GAAP gross margin 87.9%, op margin 77.7%
- $6.1M revenue per employee (898 people) — among the highest measured
- SEC inquiry closed with no recommended action (Aug 2026)
- AXON self-serve fully opened (Jun 2026) + e-commerce 11% share — second blitz begins
Concerns
- Three short-seller reports + 2 class actions unresolved for 20 months
- Founder voting control ~67% (controlled company) + $50M related-party writedown
- Q2 2026 guidance miss (−19.66%) — stock hostage to "model improves every quarter"
- Insider selling 1,207 vs 8 buys (2021–2024 Form 4)
Research notes
Score: 69/100, Grade B. A (Speed) 21/25, B (Moat) 46/60, C (Creative destruction) 11/15, D (Demerits) −9. Total = 21 + 46 + 11 − 9 = 69. Gates: G1 PASS, G2 PASS (estimated). No FLAG. Coverage: first scoring, confidence high, based on listed-company SEC filings. Q3 2026 results, due in early November 2026, fall after T and are excluded; Q3 guidance issued before T is included.
1. Current Position
AppLovin Corporation (NASDAQ: APP) arrives at this first BlitzLab scoring as a company that has finished becoming something else. The score file records the transformation in a single date: on 2026-06-30 the sale of the apps business, the game-studio division, was completed, and with it AppLovin ceased to be a hybrid of game developer and advertising platform and became a pure advertising platform. The consideration recorded in the score file was $715.6 million, comprising $430.6 million in cash plus an approximately 22% stake in Tripledot. That transaction is not a footnote to the score; it is the hinge on which the gate verdicts turn. Before the sale, AppLovin carried the losses of a discontinued operation and the identity of a company that both made games and sold advertising against them. After the sale, the discontinued-operation losses are removed, the margin profile steps into an 82–84% adjusted EBITDA margin zone, and the growth story can be read as a platform story rather than as a portfolio story. The score file's judgment is that this completes a structural transition, and that judgment is what carries G1, the gate for sustained growth or a second growth curve, to a confirmed PASS.
The growth record that supports that verdict is unusually steep for a company of this size, and it is worth stating in full because the score's speed section depends on it. Revenue was $1.84 billion in fiscal 2023, then $3.22 billion in fiscal 2024, an increase of 75.1%, then $5,480,717 thousand in fiscal 2025, an increase of 70.0%. The most recent quarters continue the pattern at a decelerating but still rapid pace: $1,842 million in the first quarter of 2026, up 59%, and $1,923,686 thousand in the second quarter of 2026, up 52.8%. Trailing twelve-month revenue at T stood at approximately $6.83 billion, up roughly 53%. The score file is explicit that the deceleration matters — growth is slowing from the 70% range toward the 50% range — and that is why growth scores 9 rather than 10, a mark the model reserves for three consecutive years of growth at the 100% order. But a company growing above 50% on a trailing base near $6.8 billion is still, in the model's language, a blitz in motion rather than a blitz remembered. The classification recorded in the score file is GROWTH, and the trailing revenue figure is what sets the second gate: G2 requires a new market whose ten-year ceiling is at least ten times current revenue, a bar of approximately $68.3 billion, and the score file passes it on an estimated basis, as discussed below.
The current score of 69/B sits four points above the 65-point pass line, and that narrow margin is itself informative. It is not a score built on one dominant strength papering over weakness elsewhere. Speed contributes 21 of 25, moat 46 of 60, and creative destruction 11 of 15 — three solid but not maximal sections — and deductions of 9 points pull the total back from 78 to 69. On the model's radar axes, rescaled to 100, that reads as speed 84.0, moat 76.7, and creative destruction 73.3. The profile is therefore balanced in a specific way: the fastest axis is speed, the moat is broad but discounted for concentration and for the dual-role problem described below, and creative destruction is real but incomplete, because the second blitz it describes has only just opened. A reader who wants the one-sentence version of this company at T will find it in the score file's own framing: a business operating at an A-level on speed and efficiency, held to a B by a trust record that the market has not yet cleared.
2. Speed: Growth Without the Usual Trade
The most striking feature of AppLovin's speed section is not the growth rate alone but the fact that the growth arrives without the trade that blitzscaling theory normally expects. The textbook pattern is speed first and efficiency later: a company burns capital and margin to win a market, then harvests. AppLovin, on the figures in the score file, does both at once. Revenue rose 70.0% in fiscal 2025 while the GAAP gross margin reached 87.9%, up from 83.9% in fiscal 2024 and 80.6% in fiscal 2023. In the second quarter of 2026 the operating margin was 77.7% and the continuing-operations net margin was 65.8%, with the adjusted EBITDA margin moving from 82.3% toward 84%. That combination — growth above 50% with a gross margin near 88% — is why the moat section awards the maximum 12 points for gross margin, and why the score file calls the profile rare: speed and efficiency combined rather than traded against each other.
The second speed item, capital velocity, scores 4 of 5, and the reasoning shows the model's discipline about distinguishing access to capital from the condition of the capital window. On access, AppLovin is at the top tier: a market capitalization of approximately $103.9 billion as of September 2026, no equity raise on the record, and a disciplined repurchase program that retired a cumulative 22.8% of shares outstanding, with $2.58 billion repurchased in fiscal 2025 and a $1.8 billion authorization remaining. The single point withheld reflects a counterweight recorded in the score file: the share price had fallen 54% year to date, so the financing window that the market capitalization implies is theoretical rather than demonstrated. The score thus credits the balance-sheet and repurchase facts, which are confirmed, while refusing to treat a large market capitalization as equivalent to an open window when the price record says otherwise.
The third speed item is the one that most sharply separates AppLovin from the rest of the scored universe, and it deserves to be stated plainly because it is so easily misread as a rounding artifact. AppLovin employed 898 people in total at the fiscal 2025 filing — 876 full-time and 22 part-time or intern staff, across 15 countries — and on that headcount it generated $5.48 billion of revenue. Revenue per employee was $6.10 million for fiscal 2025 on the score file's calculation, and approximately $7.61 million on a trailing twelve-month basis. The score file awards the maximum 5 points and calls this software productivity at its extreme, and the description is proportionate: 898 people operating a platform that touches more than 1.8 billion devices is not a staffing model that scales by hiring. It is a staffing model that scales by model improvement, which is why the distribution section below treats model improvement itself as the distribution channel.
The fourth speed item, share velocity, is where the first check on the growth story appears, scoring 3 of 5. The measured share of gaming user acquisition is approximately 40% as of 2025, cited from AppsFlyer and labeled estimated in the score file. That is a leading position in the first market, but the second front is early: e-commerce advertising volume is recorded at 11%, based on a Jefferies survey and labeled press-reported. An Edgewater channel check, also press-reported, is recorded as pointing to stalled share expansion in the gaming market. The score file's judgment follows directly: a dominant but maturing first position plus an early second position averages to a middle mark. The distinction between the two numbers matters for everything that follows, because the company's future speed depends less on defending the 40% than on whether the 11% becomes a second curve of comparable scale.
3. Moat: The Auction That Learns
AppLovin's moat is a two-sided platform joined to a data flywheel, and the score of 46 of 60 reflects both the strength of that construction and the specific reasons it cannot yet be scored as impregnable. The platform has two named parts. MAX is the mediation layer on the publisher side, and AXON is the advertising engine on the advertiser side. Together they reach more than 140,000 apps and more than 1.8 billion devices, according to company statements as cited in the score file. The two-sided structure works in the familiar way: publishers bring supply, advertisers bring demand, and each side makes the platform more valuable to the other. The pricing recorded in the score file gives the mechanism its edge: third-party bids pay a 5% fee, while AppLovin's own winning bids take a 20–30% revenue share. Every auction therefore produces data, and that data feeds back into AXON's learning, so that more auctions make the engine smarter and a smarter engine draws more advertisers. That loop is the data network effect at the center of the score file's blitzscaling analysis, and it is the company's primary growth lever.
The network-effect item scores 11 of 18, in the middle of the 10–14 band the score file applies, and the reasoning is as important as the number. The discount has two parts. First, advertisers can multi-home: nothing in the score file suggests an advertiser is locked into AppLovin alone, so the demand side of the network is contestable in a way that a consumer social network's user base is not. Second, and more structurally, AppLovin is both the operator of the auction and its largest bidder. That dual role is the source of the information-asymmetry criticism recorded in the score file: the party that runs the marketplace also competes in it, with a view of the auction that other participants do not share. In blitzscaling language this is an unfair advantage, and the score file is candid that unfair advantages of this kind are double-edged — the same structure that accelerates the flywheel also supplies the suspicion that feeds the deductions section. A moat built on an auction the owner also plays in cannot be scored as if it were a moat built on a protocol nobody owns, and the 11 reflects that distinction.
Distribution scalability scores 13 of 18, and here the score file documents one of the cleanest efficiency facts in the entire scoring set. Sales and marketing expense fell from 3.7% of revenue in fiscal 2025 to 3.3% in the second quarter of 2026, and in absolute terms sales and marketing spending declined 19.5% during a period in which revenue rose 70%. The score file's gloss on this fact is concise and worth preserving: model improvement is distribution. When AXON performs better, advertisers spend more without AppLovin spending more to reach them, so the product's performance does the work that a sales force would do elsewhere. The catalyst recorded for the next phase is the full opening of the AXON Ads Manager self-serve product in June 2026, following its launch in October 2025, which converts the platform from a managed service for a limited set of advertisers into a channel that any advertiser can enter directly. The points withheld reflect advertiser concentration: the advertiser base remains weighted toward gaming, so the distribution machine that is so efficient in its first market has not yet demonstrated the same breadth in its second.
Market size scores 10 of 12, and the gap between 10 and 12 is a disclosure gap rather than a market gap. The addressable e-commerce advertising market is estimated at $500 billion or more, on analyst and press aggregation labeled estimated in the score file, and that single market alone is more than seven times the approximately $68.3 billion G2 bar. G2 therefore passes on an estimated basis. The two points withheld follow from a simple fact: e-commerce revenue is not separately disclosed in the financial statements, so the score file cannot verify from filings how much of the current business already comes from the market that is supposed to carry the second curve. The moat section thus ends where it began, with a platform whose mechanism is demonstrated and whose second market is large but not yet separately measured — a moat that is wide in its first market and unproven in its second.
4. Creative Destruction: Replacing Manual Purchasing — and Itself
Creative destruction scores 11 of 15, and the three items inside it describe three different kinds of replacement, each at a different stage of completion. The first, the order being replaced, scores 4 of 5. In gaming user acquisition, the order being replaced is manual media purchasing: human buyers selecting placements, negotiating, and optimizing campaigns by hand. AXON replaces that work with automated optimization, and the score file records a measured result rather than an aspiration — net revenue per install rose 58% year on year. The replacement extends beyond gaming in the score file's account, because the self-serve AI platform extends the same automation into e-commerce and into connected television through Wurl, and because the sale of the apps business replaced the company's own identity, from game company to advertising platform. A company that destroys its own prior identity as part of its strategy is doing creative destruction in the literal sense, and the score file credits it accordingly while withholding the final point until the replacement is further along in the new markets.
The second item, irreversible behavior change, scores 3 of 5, and the distinction the score file draws here is between dependence and transformation. On the publisher side, dependence on MAX mediation has become infrastructural: monetization infrastructure is not something a publisher swaps casually, and the score file treats that dependence as approaching standardization within the gaming industry. On the advertiser side, bidding on the basis of return on advertising spend through automated systems has become routine, and consumer advertiser spending rose 28% against the fourth-quarter 2025 peak season, a figure the score file cites from second-quarter 2026 earnings coverage. What keeps the score at 3 rather than higher is scope: the behavior change is close to standard inside gaming, but it is not yet a general change in how advertising is purchased across industries. A standard inside one vertical is not yet a new order for advertising as a whole, and the score file's restraint on this point is consistent with its restraint on market size — both items wait on the second curve to prove itself outside gaming.
The third item, cost-structure change, scores 4 of 5, and it is the most directly evidenced of the three. AXON model improvement means that the same advertising spend produces more installs or more purchases: the unit economics of customer acquisition improve structurally rather than cyclically, because the improvement lives in the model rather than in a temporary price or placement advantage. The score file records measured values in support of this claim, cited from second-quarter 2026 earnings coverage, and the logic connects back to the distribution section: if the model improves, the advertiser's cost per outcome falls, the advertiser spends more, and the platform's revenue grows without a corresponding growth in its own sales cost. That loop is the economic engine of the whole score, and it is why the score file treats model improvement not as a product feature but as the company's cost structure, distribution channel, and moat in a single mechanism.
5. Deductions and Risks: An A Business, a C Record on Trust
The deductions section is where this score becomes genuinely two-sided, and it is the section that most distinguishes AppLovin from a straightforward high-growth platform story. Total deductions are 9 points, below the 15-point threshold that would trigger a FLAG, so no FLAG is recorded. But 9 points is enough to move the total from 78, which would sit comfortably in the upper part of Grade B, to 69, four points above the pass line. The score file's summary phrase is blunt: the business is A-level, trust is C-level. Each deduction deserves separate treatment, because each has a different evidentiary status and a different path to resolution.
Revenue quality, D2, deducts 4 points, and it is the deduction with the most contested evidence. Three short-seller reports are recorded in the score file, all labeled as claims on a press-reported basis: Fuzzy Panda and Culper on 2025-02-26, Muddy Waters on 2025-03-27, and a Culper follow-up in June 2026. Two securities class actions were pending at T, one consolidating three cases filed in 2025 and one filed in 2026, with damages undetermined. Against those claims stand three mitigating facts, all recorded in the score file: the Securities and Exchange Commission investigation was closed on 2026-08-05 with no recommended action, there has been no revenue restatement, and the auditor, Deloitte & Touche, has served since 2015 and remains in place. The score file calibrates the deduction by precedent, applying the same 4-point scale used for SoFi, which also carries a 4-point revenue-quality deduction, and the reasoning is that twenty months of unresolved claims cannot be scored as zero even after a regulatory clearance, because the market's doubt has itself become structural. The clearance removes the regulatory tail; it does not remove the litigation or the doubt, and the score reflects exactly that partial resolution.
Governance, D3, deducts 3 points, and unlike the revenue-quality item its facts are confirmed rather than alleged. Class B shares carry 20 votes per share, and the founders and affiliates — Foroughi and Chen together with affiliated holders — control approximately 67% of voting power, making AppLovin a Nasdaq controlled company. Two related-party facts compound the structural concern. KKR Denali fully exited in 2024, which removes one overhang, but Humans, Inc., where a director overlap exists and into which AppLovin invested $50.0 million in a Series C round, was fully impaired in 2025, with going-concern uncertainty recorded for that investee. A further approximately 22% stake in Tripledot, received as part of the apps-business sale, adds a second concentrated related holding. The insider transaction record from local Form 4 data for 2021–2024 completes the picture: 1,207 sale transactions against 8 purchase transactions totaling $10.5 million. The score file treats this asymmetry as structural rather than incidental, and the 3-point deduction follows from the concentration of control itself, not from any single transaction. A controlled company can still be well run; the deduction records that outside holders have limited structural recourse if it is not.
Regulatory and social cost, D4, deducts 2 points, and it is the smallest deduction but the one most directly tied to open-ended exposure. The two pending class actions carry undetermined damages, so the financial consequence cannot be bounded from the score file's evidence, and the second-quarter 2026 filing's risk factors record continuing exposure under the California Consumer Privacy Act and its successor, the California Privacy Rights Act, together with the Children's Online Privacy Protection Act. The regulatory picture is therefore mixed in the same way as the revenue-quality picture: the SEC investigation's closure on 2026-08-05 materially reduces regulatory risk, while litigation and privacy-law exposure remain open. The 2-point deduction records the remainder as a concern rather than as a trigger, which is the model's language for a risk that is real but not yet quantified.
Debt, D1, deducts nothing, and the zero is as informative as the deductions because it rules out the most common way a high-growth story ends. Long-term debt stood at $3,513 million, with no repayments due in 2026 through 2028, $1 billion due in 2029, and $2.55 billion due thereafter, against cash of $3,053 million at the second quarter of 2026. Net leverage was approximately 0.1 times trailing twelve-month adjusted EBITDA. The score file records no trigger, and the maturity profile explains why: the nearest wall is years away, and the cash balance covers the great majority of the total debt stock. Whatever AppLovin's risks are, on the score file's evidence, near-term financial distress is not among them.
The score file also records a valuation note that is explicitly excluded from the score, and it belongs in any honest account of the company at T because it explains the tension between the business score and the market record. Market capitalization was approximately $104 billion in September 2026, with a trailing price-to-sales ratio of approximately 15 times and a forward price-to-earnings ratio of approximately 20 times, both on a press-reported basis, and the share price had fallen 54% year to date from a record of $724.62 on 2025-12-09. The score file follows the BlitzLab lesson drawn from the ARK test — a business score does not look at price — and excludes all of this from the 69. But the divergence is itself evidence about trust: a business growing above 50% with an 88% gross margin does not ordinarily lose more than half its value in a year unless the market doubts something the income statement does not show, and the deductions section names what is doubted. The second-quarter 2026 guidance miss, which the score file records as producing a 19.66% fall, shows how that doubt is priced: when a company's story is that the model improves every quarter, a quarter in which the improvement is described by the chief executive as a matter of timing becomes a referendum on the story itself.
6. Blitzscaling Lens: The Re-Blitz at the Junction
Read through the blitzscaling lens, AppLovin is best understood as a mature blitzer opening a second blitz while the first blitz's efficiency is still intact, and the score file makes the comparison with Tesla explicit in order to show how the two cases differ. Tesla's structure, in the score file's account, is a core business in deceleration plus second curves still preparing; AppLovin's structure is the reverse, a first curve still efficient plus a second curve just opening. The gaming user-acquisition blitz of 2023–2025 is recorded as ended, with measured share near 40% and the Edgewater check pointing to stalled expansion — the plateau that marks a blitz's completion. The e-commerce and connected-television blitz is recorded as in its first act, with the self-serve opening of June 2026, the AXON Ads Manager launch of October 2025, and e-commerce advertising volume at 11% as its opening markers. The current 69/B is therefore best read as the score of a junction: the point at which two blitzes connect, where the first still contributes the economics and the second has not yet contributed the scale.
The growth-lever analysis in the score file assigns AppLovin a primary lever of data network effects plus a two-sided market platform, a secondary lever of self-serve distribution, and a weak lever of virality, which is absent because the business is business-to-business. The observation that model performance itself is the salesperson captures the substitution precisely: in a consumer blitz, users recruit users, while here performance recruits advertisers, and performance is a property of the model rather than of the user base. That substitution has a consequence the score file states as its central paradox, and it is the most original observation in the entire scoring: AppLovin did not pay the speed-versus-efficiency trade at all, and that very perfection is the seed of doubt. The short-seller reports' shared logic, as recorded in the score file, is essentially that the efficiency is too good to be believed, and the revenue-quality deduction exists because that logic found an audience. The blitzscaling lesson the score file draws is general and worth stating in full: when efficiency becomes too perfect, trust itself becomes a cost. A company can be penalized not for being inefficient but for being efficient in a way that observers cannot reconcile with their model of how the business works.
The single largest risk identified in the score file's blitzscaling analysis follows from the same mechanism. The market's belief in continuous quarterly model improvement has become part of the business, in the sense that guidance, and therefore the share price, is set on the assumption of a meaningful model lift every quarter. The second-quarter 2026 episode demonstrates the structure: a guidance miss produced a 19.66% fall, and the chief executive's acknowledgment that the quarter was a matter of timing did not prevent the repricing. If model improvement pauses for even one quarter, the chain the score file describes runs from guidance miss to trust collapse to litigation exposure, because the pending class actions supply a ready-made vehicle for disappointed expectations. This is the inversion of the blitzscaling maxim that speed is a moat: here speed — the pace of model improvement — has become a liability, because the moat depends on a pace that cannot be guaranteed quarter by quarter. The score of 69/B prices that inversion only partially, through the 9 points of deductions; the market record prices it more severely, and the gap between the two is the central question for the next scoring.
7. What to Watch
The watch list that follows from the score file is short, because the score's structure concentrates the future into a small number of observable tests. First, the second-quarter 2026 pattern must be tested against the third-quarter 2026 results, which fall after T and are therefore the first new evidence the next scoring will admit: whether revenue growth remains above 50%, whether the gross margin stays near the fiscal 2025 level of 87.9%, and whether the adjusted EBITDA margin remains in the 82–84% zone that the apps-business sale opened. A second consecutive quarter in which model improvement is described as a matter of timing would convert the single largest risk from a demonstrated episode into a pattern, and the score file's framework would have to treat it as such.
Second, the second curve must become measurable. The two figures to watch are the e-commerce advertising volume, recorded at 11% on a Jefferies survey basis, and the disclosure question behind the withheld B3 points: whether e-commerce revenue begins to be reported separately, or at least described with enough precision that the second curve's scale can be verified from filings rather than from surveys. The self-serve channel is the mechanism to watch alongside the numbers, because the June 2026 full opening is recent at T and its advertiser intake, rather than its launch announcement, is the evidence that matters. Connected television through Wurl belongs on the same watch list, as the third leg of the second blitz, though the score file records less detail on it than on e-commerce and the next scoring should not over-weight an unmeasured leg.
Third, the trust record must move in one direction or the other. The pending class actions — three 2025 cases consolidated plus one 2026 case — are the open item with the least predictable timeline, and their resolution, in either direction, would change the deductions section more than any single operating figure. The SEC closure of 2026-08-05 already removed one overhang; a litigation resolution would remove another, while an adverse development would confirm the structural character of the doubt the score file describes. The governance facts, by contrast, are unlikely to move quickly: a 67% voting concentration, a controlled-company status, and an insider-sale asymmetry of 1,207 to 8 are structural features, and the watch item there is not their disappearance but whether any new related-party event joins the Humans, Inc. impairment as a second data point.
Fourth, the gaming base must be monitored for the plateau the Edgewater check already signals. Measured share near 40% is a strong position, but a strong position that has stopped expanding contributes no further speed, and the score file's A4 mark of 3 already reflects that judgment. The question for the next scoring is whether gaming revenue stabilizes as a funding base for the second blitz — the healthy version of a plateau — or whether it begins to decline and forces the second curve to carry growth before it is ready. The debt profile gives the company time for either outcome, with no maturities due before 2029 and net leverage near 0.1 times trailing adjusted EBITDA, so the watch item is operating rather than financial: the junction holds as long as the first curve funds the second, and it strains if the first curve needs funding itself.
AppLovin at 69/B is, finally, a study in a specific blitzscaling configuration: a platform whose economics are stronger than its trust record, whose efficiency is so complete that it generates its own suspicion, and whose future depends on a second market that is large, early, and not yet separately disclosed. The score file's judgment that the company passes both gates — sustained growth confirmed, and a new market ceiling estimated at more than seven times the bar on e-commerce alone — is the reason the company is scored at all rather than gated out. The judgment that deductions of 9 points keep it four points above the line is the reason the score is a B rather than an A. Both judgments will be tested by the same evidence: whether the model keeps improving, whether the second curve becomes measurable, and whether the trust record that has been open for twenty months begins to close.
More Platforms companies
Other Platforms names on the Blitz Index, highest score first: Alphabet (83/A), Meta (78/B), Airbnb (76/B).
Next earnings
Q4 2026 · Expected
Coverage
As of October 2026 · Model v1.0 (frozen) · Confidence: High (listed, SEC filings) · Not investment advice — a scholar's assessment.
Embed this score
Copy the HTML below to show this score on your site. The badge links back to this page and updates automatically when the score changes.
Preview:
BlitzLab scores businesses against a scholar’s standard — not investment advice. No price targets, no buy/sell recommendations. Figures are from SEC filings (XBRL) as labeled in the source scorecard.