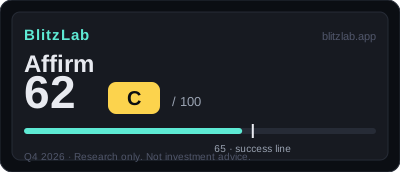
Affirm — Blitz Index 62 (B)
$50B of GMV and the first operating profit — but Amazon is 22% of it.
Last re-scored: November 5, 2026.
Confidence: High · Category: platforms
Score breakdown
| Section | Score | Detail |
|---|---|---|
| A · Speed | 21 / 25 | GMV $50.2B — 2.5x in 3 years at 30%+; repeat rate 96% × 7.0 transactions per consumer |
| B · Moat | 39 / 60 | Transaction data improves underwriting (10-K); Affirm Card 15% of volume — the D2C leg growing |
| C · Creative destruction | 11 / 15 | Credit-card replacement thesis — G2 passes only if the substitution scenario holds |
| D · BlitzFailing | −9 | Amazon 22% + top 5 partners 44%; $1.5B of $1.93B net income is a non-cash tax reversal; loss cost 18.7% of revenue |
Think we scored it wrong? Score it yourself →
Radar axes (0–100): Moat 65 · Speed 84 · Creative 73.
Watch item
Gates: G1 ✓ · G2 ✓ (conditional). 3 points below the threshold — profitability turned, concentration didn't.
Strengths
- GMV 2.5x in 3 years ($20.2B→$50.2B, SEC) — consistent 30%+ growth
- Repeat 96% × 7.0x per consumer — the network deepens, quantified
- First operating profit (+$417M, SEC) — scale economics working
- Affirm Card at 15% of volume — the high-growth D2C leg
Concerns
- ~$1.5B of $1.93B net income is a non-cash tax reversal — headline profit distorted
- Amazon 22% + top 5 at 44% — the Walmart→Klarna precedent
- Klarna's post-IPO US push — BNPL round two intensifies
- Loss costs at 18.7% of revenue — a credit-cycle turn hits directly
Research notes
Affirm Holdings, Inc. is a checkout-credit company founded in 2012 by Max Levchin, a co-founder of PayPal, and listed on Nasdaq on January 13, 2021. Its first BlitzLab score, set as of October 18, 2026, is 62 out of 100, grade B: Speed 21 out of 25, Moat 39 out of 60, Creative Destruction 11 out of 15, and deductions of 9 points. The total sits three points below the 65-point threshold, and the score file records no FLAG, since deductions of 9 fall short of the 15-point FLAG line. That combination — a company that has already crossed into operating profitability, yet still falls short of the top tier — is the right frame for reading Affirm. The business has proved that its model can scale and make money at the operating line. What it has not yet proved, on the evidence available at the scoring date, is that its distribution can be diversified enough, and its addressable market large enough on a realistic path, to carry it into the highest tier.
The scoring date matters. The latest results available at T were the fiscal 2026 Form 10-K, filed on August 27, 2026, covering the fiscal year from July 1, 2025 to June 30, 2026. Affirm reports on a June year-end, so its fiscal 2026 is the year that ended in mid-2026. Results for the first quarter of fiscal 2027, the quarter ended September 30, 2026, were due on November 5, 2026 and therefore fall after T; they are excluded from this assessment and appear below only as a next marker, not as an outcome to be anticipated.
Thesis: credit, not just convenience, at checkout
The conventional way to describe Affirm is as a buy-now-pay-later company: a consumer splits a purchase into instalments at the point of sale. The score file argues that this description understates what the company is actually building, and the numbers support the broader reading. Affirm's product is credit underwriting delivered in real time, at the moment of purchase, inside someone else's checkout. The consumer sees a transparent instalment plan with no late fees, no hidden fees, and no compounding interest; the merchant sees higher conversion and a higher average order value; Affirm sees a credit decision, a stream of repayment data, and, when the customer returns, a richer picture of that borrower than it had the first time. The company's own phrase, quoted in its filings, is "honest financial products," and the score file treats that transparency not as marketing but as the core of the creative-destruction claim: the order being displaced is the legacy credit card, with its late fees, hidden charges, and compounding balances.
That thesis is what makes the growth record interesting rather than merely fast. Gross merchandise volume rose from $20.2 billion in fiscal 2023 to $50.2 billion in fiscal 2026, a two-and-a-half-fold increase in three years, with annual growth of 32 to 38 percent across that span. The year-by-year path, all confirmed from SEC filings, runs from $26.6 billion in fiscal 2024, up 32 percent, to $36.7 billion in fiscal 2025, up 38 percent, to $50.2 billion in fiscal 2026, up 37 percent. Revenue followed a similar arc: $1,588 million, then $2,323 million, up 46.2 percent, then $3,224 million, up 38.8 percent, then $4,261 million in fiscal 2026, up 32.2 percent. The fourth quarter of fiscal 2026 alone contributed $1,166 million of revenue, a figure derived from SEC filings. Three consecutive years above 30 percent growth, sustained all the way to a $50 billion volume scale, is the substance behind the growth subscore of 9 out of 10 — high, but not maximal, because the question for a blitzscaling assessment is not only how fast a company has grown but whether that pace can be repeated at an even larger scale.
The second growth curve is already visible. The Affirm Card, a physical and digital card that lets consumers use Affirm at merchants that have no direct integration, accounted for 15 percent of transactions in fiscal 2026, up from 8 percent in fiscal 2024. That matters because it changes the shape of the network: Affirm is no longer confined to the checkouts of its integrated partners. International expansion is the other second curve named in the score file, with the United Kingdom, Canada, and Australia — Australia in the first quarter of fiscal 2027 — and continental Europe named as the direction of travel. Both are still early relative to the core United States partner business, which is one reason the overall score stops at 62 rather than higher. The second curves exist and are growing; they have not yet been proved at a scale that dilutes the concentration of the first.
Speed: a fast company that has learned to make money
Speed, in the BlitzLab model, is not only growth. It combines growth with capital velocity, hiring productivity, and share momentum, and Affirm scores 21 out of 25 across those four items. The growth item, at 9 out of 10, has been covered above. Capital velocity scores 4 out of 5. The market capitalisation is approximately $25.6 billion on a press-reported basis, and the funding picture at T shows a company with access to capital but with one near-term event to watch: convertible notes of $1.14 billion in total, of which the 2026 notes of $221.3 million mature on November 15, 2026, about a month after T. Alongside that maturity sits an undrawn $675 million revolving facility and an S-3ASR shelf registration, both confirmed from SEC filings, and a $250 million share repurchase in fiscal 2025. The subscore reflects that balance: access to capital itself looks adequate, while the single near-term maturity is a refinancing event to monitor rather than a verdict on the funding model as a whole.
Hiring productivity scores 4 out of 5, and the arithmetic is striking. Affirm employed 2,358 people at the scoring date, confirmed from SEC filings, which implies revenue of $1.81 million per employee on fiscal 2026 revenue, a calculated figure that the score file describes as among the highest in the buy-now-pay-later group. There is no union, also confirmed from the filings. A company that can carry $50.2 billion of volume and $4.26 billion of revenue on a workforce of that size is running a heavily automated operation: underwriting, servicing, and partner integration are software problems before they are headcount problems. That leanness is part of the operating leverage story, and it helps explain how the company reached profitability without the headcount bloat that often accompanies rapid scaling.
Share momentum scores 4 out of 5, and here the evidence is behavioural rather than merely volumetric. Active consumers reached 27.8 million, up 21 percent year on year, transactions per consumer reached 7.0, up 20 percent, and repeat transactions accounted for 96 percent of the total, all confirmed from SEC filings. Those three figures together describe wallet-share expansion: not just more people trying Affirm once, but the same people using it more often. The Affirm Card's rise from 8 percent to 15 percent of transactions reinforces the same point, since it shows consumers carrying Affirm beyond its integrated checkouts. The one discount in this item is competitive: Affirm's positioning as a United States buy-now-pay-later leader sits alongside the press-reported fact that Klarna's global gross merchandise volume is roughly three times Affirm's, a reminder that leadership in one market is not the same as leadership worldwide.
Moat: a two-sided network whose edge is credit data
Moat is the largest section of the model at 60 points, and Affirm scores 37. The single most important idea in the score file is that Affirm's moat is not payment convenience. Convenience is easy to copy; a rival can build a checkout button. What is harder to copy is the underwriting record that accumulates when 27.8 million consumers transact with 571,000 merchants, both figures confirmed from SEC filings, and when 96 percent of transactions are repeats. The score file quotes the mechanism directly from the 10-K management discussion: repeat consumers generate additional data, that data improves underwriting, and repeat consumers carry lower loss provisions and processing costs than new consumers. Every transaction is therefore both a sale and a training observation. The moat item for network effects scores 12 out of 18 — a strong score that stops short of the maximum, because the network, while deep, is still concentrated in ways the next item makes explicit.
Distribution scalability scores 11 out of 18, and this is where the assessment turns most critical. Affirm distributes through two channels: its integrated partners and its own direct channel, the Affirm Card and app. The direct channel is genuinely encouraging, and international expansion adds a third direction. But the partner channel carries a concentration that the score file treats as a structural discount, not a footnote. Amazon alone accounts for 22 percent of gross merchandise volume, and the top five partners together account for 44 percent, both confirmed from SEC filings. The contracts behind those relationships are non-exclusive, carry no volume commitments, and can be terminated on 30 to 90 days' notice, as stated in the 10-K itself. That combination — high concentration plus short, non-exclusive contracts — is a live risk, not a hypothetical one. The score file cites the precedent of Walmart moving to Klarna, a press-reported event estimated to have affected roughly 5 percent of gross merchandise volume and roughly 2 percent of adjusted operating income. The same yardstick applied to another concentrated company in the coverage universe, ALAB, whose single-customer concentration above 70 percent drew a distribution discount, is applied here. Concentration is therefore charged once in distribution, and, as discussed below, again in the deductions.
Market size scores 8 out of 12, and this item carries the most consequential judgement in the whole assessment: the second gate, G2, passes, but only narrowly and only conditionally. The gate asks whether the ten-year ceiling of the new market is at least ten times current revenue. Ten times fiscal 2026 revenue of $4,261.1 million gives a bar of approximately $42.6 billion, an estimated figure. At the confirmed take rate of 8.49 percent, reaching that revenue requires roughly $500 billion of gross merchandise volume. The buy-now-pay-later market alone does not get there: Klarna's fiscal 2026 guidance for gross merchandise volume is $149 to $151 billion on a press-reported basis, so Affirm would need more than three times even the largest player's guided volume. The gate passes only if the market is defined the way the creative-destruction thesis defines it — not as buy-now-pay-later, but as checkout credit, set against United States card purchase volume of more than $5 trillion. On a generous scenario in which 15 percent of that card volume is addressable to Affirm, or $750 billion, Affirm takes a 35 percent share, or $263 billion, and international business adds a further 40 percent, or $105 billion, total volume reaches roughly $368 billion and revenue roughly $31 billion — about 0.73 times the bar, still short. Only a more generous scenario, with 20 percent addressable and a 40 percent share plus 50 percent from international, reaches roughly $660 billion of volume and roughly $56 billion of revenue, about 1.3 times the bar. The gate therefore passes, but the passing scenario assumes the credit-card displacement thesis actually happens, and the score file is explicit that headroom is thin: the take rate has limited room to rise further, since the interest-bearing mix already stands at 70 percent, and Klarna's United States push and partner concentration press from the other side. The market-size subscore of 8 reflects exactly that conditionality.
Gross margin, or more precisely operating profitability, scores 8 out of 12. Fiscal 2026 operating income was positive $417 million, a margin of positive 9.8 percent, confirmed from SEC filings — the first profitable year after an operating loss of $616 million in fiscal 2024. The net interest spread of $1,593.5 million, a calculated figure representing 77.8 percent of interest income, shows the engine underneath: Affirm earns a spread between what it charges borrowers and what it pays to fund the loans. The score file is careful to separate substance from headline here, and that separation is one of the most valuable disciplines in the whole document. Net income of $1,929.8 million looks far larger than operating income, but approximately $1.5 billion of it is a non-cash reversal of a deferred tax valuation allowance, confirmed from SEC filings. The margin item is therefore assessed on operating income only, with the tax reversal set aside. What remains is a real but structurally exposed profitability: fixed-rate loans funded with variable-rate borrowing, so rising rates squeeze the spread, partly mitigated by hedging as described in the 10-K. Profitability has been achieved; it has not been made immune to the rate cycle.
Creative destruction: displacing the card, changing the cost of credit
Creative destruction scores 11 out of 15, and it is Affirm's strongest section in percentage terms. The displaced order scores 4 out of 5. The 10-K names legacy card companies — Synchrony, JPMorgan, Citi, Bank of America, Capital One, and American Express — as primary competitors, confirmed from SEC filings, which is itself evidence of how Affirm positions its contest: not against other instalment buttons, but against the card issuers whose economics depend on the fees and compounding interest that Affirm promises to remove. The mechanism is two-sided in a way that matters for the thesis. At checkout, real-time underwriting lets a consumer see a transparent plan before committing, and the merchant gains conversion and order value. Both sides of the transaction get something the card does not offer in the same form, which is why the score file treats this as displacement rather than mere feature competition.
Irreversible behaviour change scores 4 out of 5. The evidence is the same behavioural record cited under speed, read through a different lens: volume up two and a half times in three years, transactions per consumer rising from 4.9 to 7.0, the Affirm Card expanding from 8 percent to 15 percent of transactions and carrying the network beyond integrated merchants, and the swing from a $616 million operating loss to a $417 million operating profit as evidence that scale economics are actually operating. A habit that survives contact with a second and third purchase, and that migrates from a partner's checkout to a consumer's own card, is harder to reverse than a one-time promotion. The score stops short of the maximum because the habit is still disproportionately carried by a small number of large partners, and a habit carried by someone else's checkout is less fully owned than one carried by one's own.
Cost-structure change scores 3 out of 5, the lowest item in this section, and the reasoning is instructive. For merchants, the fee is justified by higher conversion and order value; for consumers, late fees and compounding interest are removed, so the cost structure of credit is made transparent. But Affirm itself carries structural costs that cap this item: funding costs of $454 million, up 7 percent year on year, and provision costs of $796.7 million, equal to 18.7 percent of revenue, both confirmed from SEC filings. Transparency changes who bears the cost and how visible it is; it does not abolish the cost of lending. That distinction keeps the item at 3 rather than higher.
Deductions and risks: the credit cycle, concentration, and governance
Deductions total 9 points, spread across all four deduction items, and each one names a distinct risk rather than repeating the same complaint. Debt scores minus 3 out of a possible minus 10. The balance sheet at T shows funding debt of $3.36 billion, securitisation of $5.35 billion, and convertible notes of $1.14 billion, all confirmed from SEC filings. The score file's key mitigating fact is that the funding debt and securitisation are matched funding against the loan book: creditors of the securitisation vehicles have no recourse to Affirm's general credit, as stated in SEC filings. Equity relative to the portfolio stands at 4 percent, also confirmed. The discount reflects what remains after that mitigation: dependence on wholesale funding rather than deposit funding — the score file contrasts Affirm with SoFi, where deposit funding exceeds 90 percent — plus the November 15, 2026 maturity of the $221.3 million 2026 notes, plus the fixed-rate versus variable-rate mismatch already noted under profitability. Matched funding lowers the risk; it does not remove the dependence on wholesale markets staying open.
Revenue quality scores minus 3. This is the credit-cycle item, judged by the same yardstick applied to NU, another lender in the coverage universe. The loss provision stands at $563.3 million, a provision rate of 5.89 percent; net charge-offs are $611.6 million; provision costs of $796.7 million equal 18.7 percent of revenue, all confirmed from SEC filings. Delinquency of more than 30 days stands at 2.51 percent, which compares favourably with NU's 6.9 percent but carries quarterly seasonality, also confirmed. The item then layers on the two non-credit risks: partner concentration, with Amazon at 22 percent and the top five at 44 percent, plus the press-reported Walmart-to-Klarna precedent; and regulation, with Affirm subject to Consumer Financial Protection Bureau supervision as stated in the 10-K, and the European Union's Consumer Credit Directive II taking effect on November 20, 2026 on a press-reported basis. Credit, concentration, and regulation arriving together is what earns the minus 3, and it is worth noting how the credit numbers cut both ways: a 2.51 percent delinquency rate is genuinely better than the comparison case, yet an 18.7 percent provision cost means that any turn in the cycle hits the income statement directly and quickly.
Governance scores minus 2 out of a possible minus 5. A dual-class share structure is confirmed, named as a risk factor in the 10-K, but the concentration of voting rights is unconfirmed in the score file. The comparison cases are instructive: NBIS, where only the structure itself was confirmed, drew minus 1, while Affirm draws one step more because Shopify is noted as a related party above 10 percent of voting rights, confirmed from SEC filings, alongside founder Levchin's concurrent roles. This is a measured deduction rather than an alarm: the structure is known, its exact voting concentration is not, and the score reflects that asymmetry rather than filling the gap with an assumption.
Regulatory and social cost scores minus 1. There are no securities lawsuits or fines recorded. The two items noted are a beta of 3.82 on a press-reported basis — roughly 3.8 times the market's volatility — and a press-reported sale of 65,591 shares by the chief financial officer, approximately $5.25 million, under a 10b5-1 plan. A planned sale is not, on its own, evidence of anything, and the score file treats it that way: the size is noted, the plan is noted, and the deduction stays at the minimum. The beta figure, by contrast, is a standing fact about the equity rather than an event: whatever the business does, its shares have moved with far greater amplitude than the market, and any assessment that ignores that volatility is incomplete.
Taken together, the deductions describe a company whose risks are concentrated rather than diffuse. There is no single catastrophic item. Instead, the same underlying exposures — credit, wholesale funding, a small number of large partners, and a rate-sensitive spread — appear in different items, each time from a slightly different angle. That is why the total deduction of 9, while below the FLAG threshold, still matters: it is the mirror image of the moat score, showing the price of the network's current shape.
Blitzscaling fit: a credit blitz, in the late first act
The score file places Affirm in the late first act of its blitz: the blitz itself is substantially complete in the United States partner channel, profitability has been achieved, and the second act — the card, international markets — is under way but not yet proved at scale. The primary growth lever is network effects through credit data, the secondary lever is distribution through partners, and the weak lever is capital: wholesale funding is a cost to be managed rather than fuel to be burned, in contrast with deposit-funded competitors. The trade-offs Affirm has accepted along the way are visible in the numbers. It has paid for speed with credit risk, carrying an 18.7 percent provision cost to sustain a no-late-fee positioning, with repeat borrowers' lower loss rates holding that structure together. It has paid for speed with partner economics, including warrant costs attached to large merchant relationships; the score file notes that sales and marketing costs fell 21 percent after warrant amortisation ended, which reads as evidence of how much of the earlier cost base was the price of distribution rather than the cost of the core operation.
The single largest risk named in the blitzscaling analysis is also the simplest to state: Amazon is 22 percent of gross merchandise volume, and the top five partners are 44 percent. Contracts are non-exclusive and terminable on short notice, and a precedent exists of a large retailer switching to Klarna. One large partner's departure would strike volume, revenue, and credit diversification at the same time. The network effect has an opposite face, and in Affirm's case that face is network concentration. The path to 65 points, six points away, runs through the same evidence in reverse: diversification of partners so that no single relationship carries this weight, and international volume proved at a scale that makes the second growth curve a genuine counterweight to the first.
What to watch
The next markers are dated, and they are the right things to watch precisely because they test the specific claims above rather than the company in general. The first-quarter fiscal 2027 results, due on November 5, 2026, fall after the scoring date and are the first post-T evidence on whether the growth and profitability trajectory continues; this assessment makes no prediction about their outcome. The maturity of the $221.3 million 2026 notes on November 15, 2026 tests the refinancing picture described under capital velocity. The entry into force of the European Union's Consumer Credit Directive II on November 20, 2026, on a press-reported basis, tests the regulatory item as the international expansion it governs gathers pace. Beyond those dates, the standing questions are structural: whether the Affirm Card continues to grow beyond 15 percent of transactions, whether international volume begins to dilute the 44 percent top-five concentration, whether the provision rate and the 30-plus-day delinquency rate hold their current levels through a full seasonal cycle, and whether the take rate can be sustained near 8.49 percent with an interest-bearing mix already at 70 percent. Each of those questions maps to a specific subscore, which is the point of the exercise: the score is not a verdict to be believed or disbelieved, but a set of claims that future filings can confirm, refine, or overturn.
A final note on price, since it is often confused with the assessment itself. The score file records a valuation note that is explicitly not reflected in the score: a share price of $74.01 on October 16, 2026, a market capitalisation of approximately $25.6 billion, a price-to-sales ratio of approximately 6.4 times, and a price-to-earnings ratio of approximately 13.7 times, all on a press-reported basis, with the earnings ratio distorted by the inclusion of the non-cash tax reversal in net income, and a 52-week range of $42.10 to $90.44. The business score deliberately does not look at price. That separation is worth preserving: a company can be well or poorly run at any price, and the evidence above is about the running of the business, not about what its shares should be worth.
Affirm at 62 is, in short, a company that has earned its operating profit and its network, and has not yet earned the diversification and market headroom that the top tier requires. The data flywheel is real, the repeat behaviour is real, and the first profitable year is real. So are the concentration, the credit cost, and the conditional gate. Three points is not a large gap, but the evidence that would close it — partners diversified, international volume proved, the spread held through the rate cycle — has to arrive in filings, not in projections.
More Platforms companies
Other Platforms names on the Blitz Index, highest score first: Alphabet (83/A), Meta (78/B), Airbnb (76/B).
Next earnings
Q4 2026 · Expected
Coverage
Affirm Holdings, Inc. · Q1 FY2027 due Nov 5, 2026 (AMC, confirmed) · Score 62 · Grade B
Embed this score
Copy the HTML below to show this score on your site. The badge links back to this page and updates automatically when the score changes.
Preview:
BlitzLab scores businesses against a scholar’s standard — not investment advice. No price targets, no buy/sell recommendations. Figures are from SEC filings (XBRL) as labeled in the source scorecard.